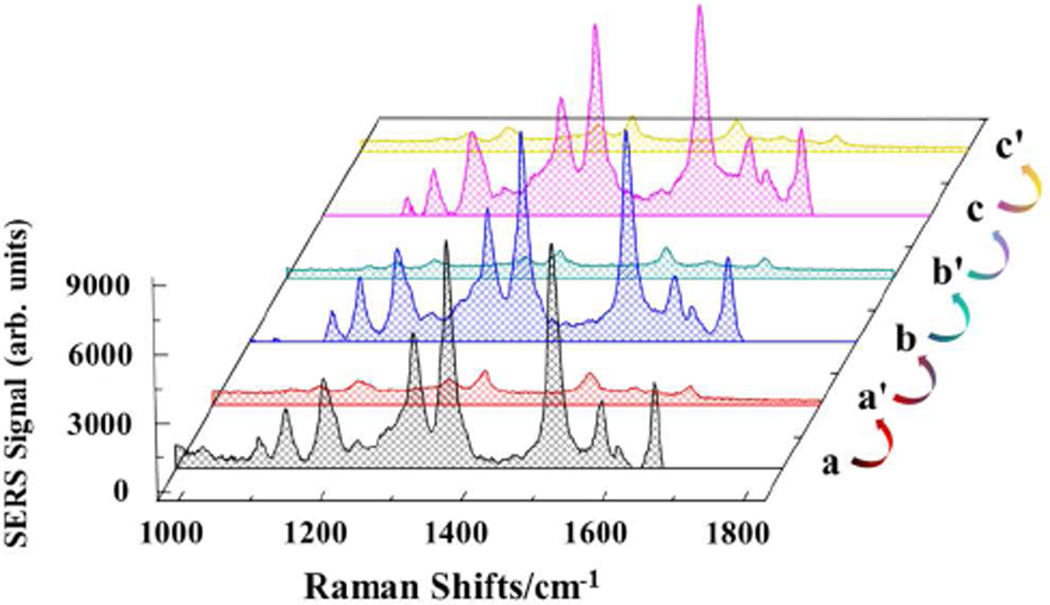
FIGURE 4.
SERS spectra of the Au film after several repeated concentration step changes between 100 nM T1 (traces a, b and c) and 1.0 µM P1 (traces a', b' and c'). The SERS spectrum was returned to its pre-exposure form by first washing with PBS 3 times and then immersing in the P1 solution for 2.0 h.

