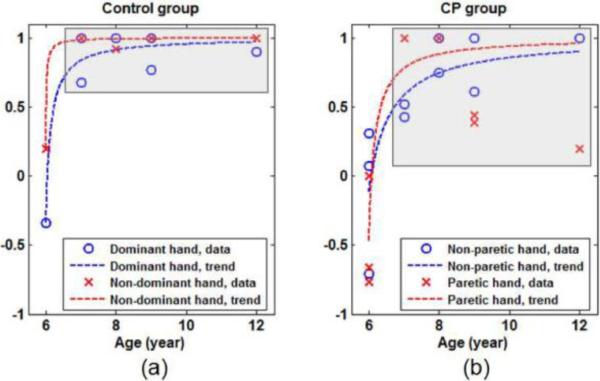
Fig. 5.

Age-dependent lateralization (L value) in both (a) Control group and (b) CP group (Some data points in each subfigure are overlapped). Both figures show that the younger subjects have lower L values, especially the 6-year-old subjects, tending to have weaker contralateral activation. In each group, the overall trend of dependence of L on age follows an asymptotic curve (shown by the dash lines). At 7 years of age and older, as marked by the gray boxes, the dependence of L on age becomes insignificant in either group.
