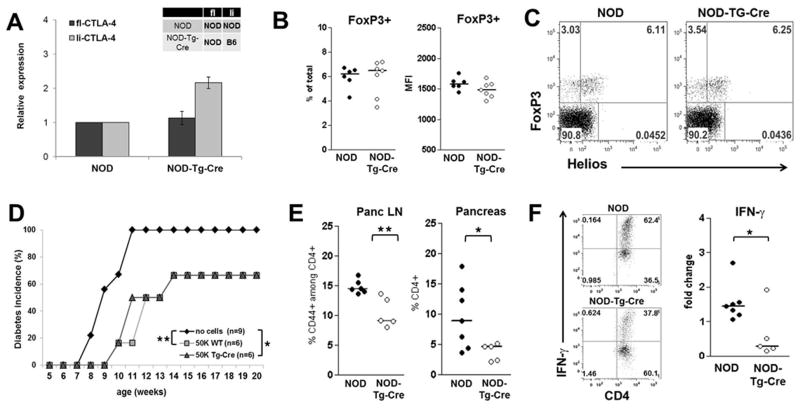
Figure 4. Expression of li-CTLA-4 in NOD mice diminishes T effector cell function but does not affect T regulatory cells.
(A) Relative levels of fl- and li-CTLA-4 mRNA expression normalized to 18S expression in sorted CD4+CD25hiCD62L− Treg cells from NOD and NOD-Tg-Cre mice (mean ± SD). (B) Regulatory T cells numbers displayed as percentage of total pancLN cells (left panel) and FoxP3 protein expression levels (right panel). (C) Percentages of natural (CD4+FoxP3+Helios+) and adoptive (CD4+FoxP3+Helioslow) T regulatory cells in pancLN cells from NOD and NOD-Tg-Cre mice. (D) Diabetes frequency in NOD.CD28KO recipients adoptively transferred with either no or of 5×10⁴ BDC2.5-Treg cells from NOD and NOD-Tg-Cre mice, respectively. Statistical analysis was performed using the Logrank test (*, P < 0.05; **, P < 0.01). (E) Percentage of CD4+/CD44+ activated T effector cells in pancLN and pancreas of NOD and NOD-Tg-Cre mice. (F) Sorted CD4+/CD62Lhi T naïve cells from lymph nodes of NOD and NOD-Tg-Cre mice were activated with anti-CD3 and anti-CD28 in the presence of 200U/ml IL2. At day 3, cells were stimulated with PMA/Ionomycin/Monensin for 5 hours and the percentage of IFN-γ producing CD4+ T cells was examined by flow cytometry. Shown are representative flow plots (F, left panel) and the fold changes (F, right panel) of IFN-γ producing CD4+ T cells from NOD and NOD-Tg-Cre mice. Statistical analyses in E and F were performed using an unpaired t test (*, P < 0.05; **, P < 0.01).

