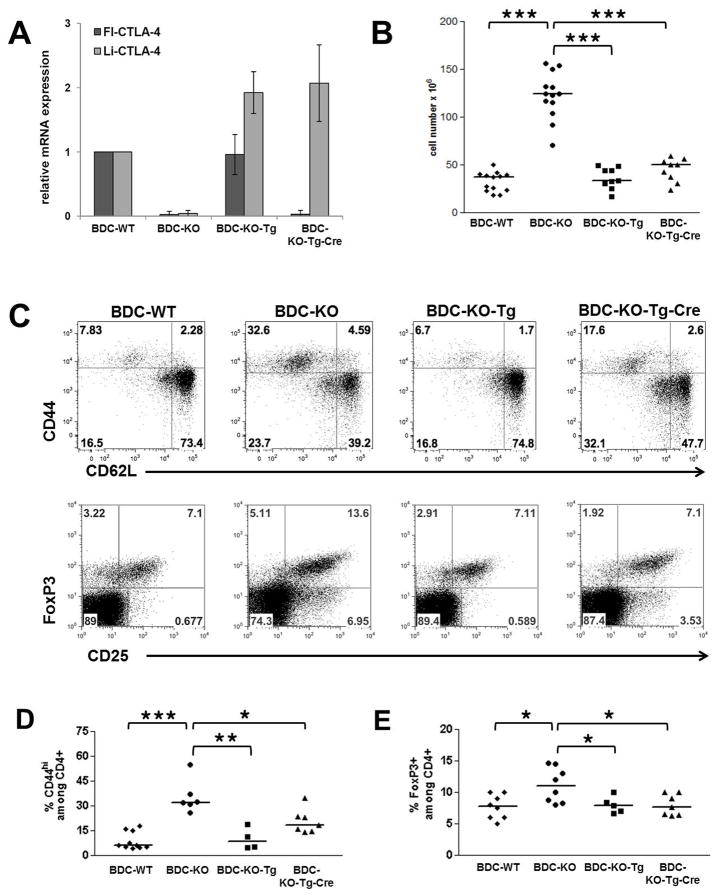
Figure 5. Selective expression of li-CTLA-4 partially rescues the T cell phenotype observed in NOD.BDC2.5.CTLA-4KO mice.
Relative levels of fl- and li-CTLA-4 mRNA expression in CD4+ T cells (A) and lymph node cellularity (B) in 6 week old NOD.BDC2.5.CTLA-4 WT, KO, KO-Tg or KO-Tg-Cre mice. (C) Representative flow plots, showing the frequencies of activated CD4+/CD44+/CD62L- T effector and resting CD4+/CD44-/CD62Lhi naïve T cells (upper panel) as well as CD4+/CD25+/FoxP3+ regulatory T cells (lower panel) in lymph node cells from 6 week old mice. (D) Quantification of frequencies of CD44+ T effector and FoxP3+ regulatory T cells determined in (C) and expressed as percentage of CD4+ T cells. Statistical analyses were performed using an unpaired t test (*, P < 0.05; **, P < 0.01; ***, P < 0.0001).

