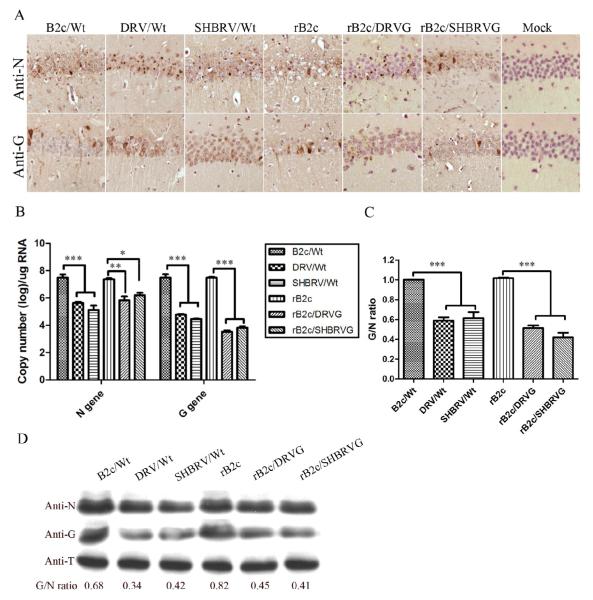
Fig. 3. Detection of viral antigens in mice at day 6 p.i. with rRABV.
RABV N and G antigens were detected by immunohistochemistry in mouse brain section (A, magnification ×20). RABV viral mRNAs were analyzed by qRT-PCR (B) and RVBV proteins (N and G) detected by Western blotting (D). The ratio between G and N was calculated with RNA copy number (C) or determined after measurement of the band density (D). As a loading control, β-tubulin was measured in the same sample preparation using anti-β-tubulin (anti-T) antibody in the Western blot assay. Significance of differences between the experimental groups was assessed by One-Way ANOVA (*, p<0.05; **, p<0.01 and *** p<0.001).

