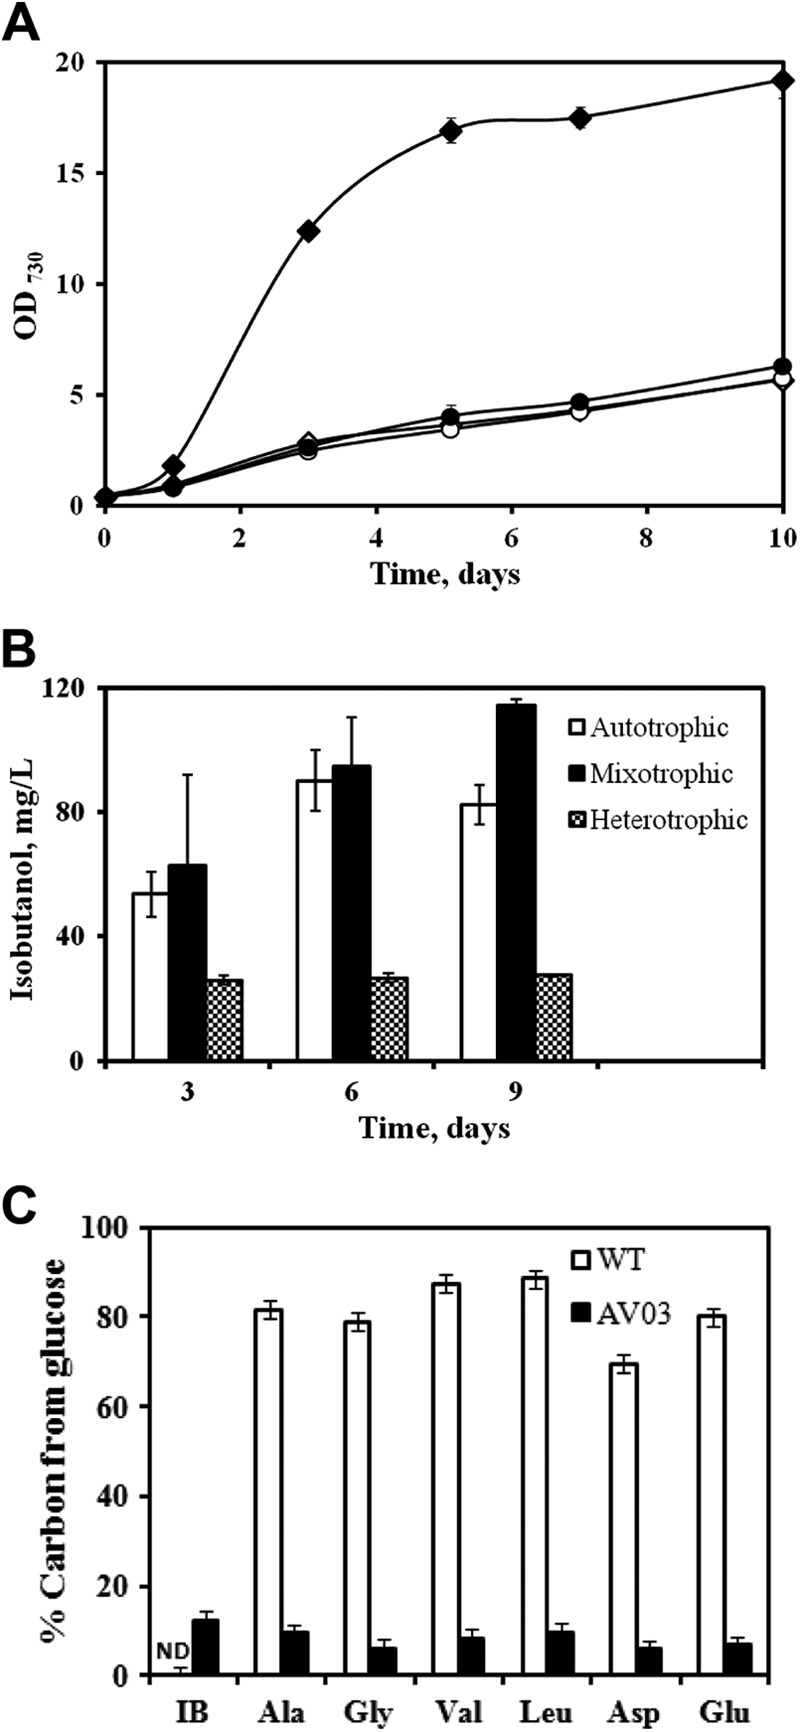
Fig 2.

(A) Growth curves of Synechocystis 6803 WT and AV03 (n = 3; shake flask cultures). ♢, WT under autotrophic conditions; ◆, WT under mixotrophic conditions; ○, AV03 under autotrophic conditions; and ●, AV03 under mixotrophic conditions (note that the growth curve of AV03 under mixotrophic conditions overlaps the autotrophic growth curves of AV03 and the WT). (B) IB synthesized in AV03 under autotrophic conditions (only HCO3), heterotrophic conditions (only glucose), and mixotrophic conditions (both HCO3 and glucose) (n = 3; shake flask cultures with closed caps). (C) Percent carbon contribution of glucose for synthesizing amino acids and isobutanol in the WT and the mutant strain (AV03) as measured on day 9 (shake flask cultures with closed caps). Isotopomer analysis (TBDMS-based method) of proteinogenic amino acids confirmed the low [13C]glucose utilization by the mutant. The error bars in panels A and B indicate standard deviations, while those in panel C represent the 2% technical error of the instrument.
