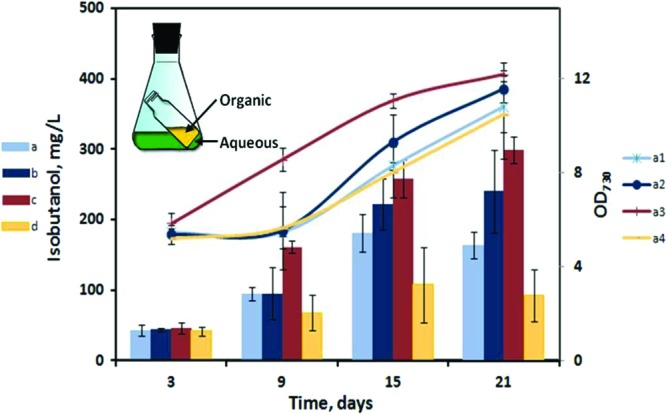
Fig 4.

Net concentration of IB synthesized (bars) and biomass growth (curves) by the AV03 culture under different conditions (n = 3). a, IB with 0.5 ml oleyl alcohol (autotrophic); b, IB with 1 ml oleyl alcohol (autotrophic); c, IB with 0.5 ml oleyl alcohol and glucose (mixotrophic); d, IB with no oleyl alcohol (autotrophic, negative control); a1, OD730 with 0.5 ml oleyl alcohol (autotrophic); a2, OD730 with 1 ml oleyl alcohol (autotrophic); a3, OD730 with 0.5 ml oleyl alcohol and glucose (mixotrophic); a4, OD730 with no oleyl alcohol (autotrophic, negative control). (Inset) Schematic representation of the in situ IB removal system used to increase the production of IB. The error bars indicate standard deviations.
