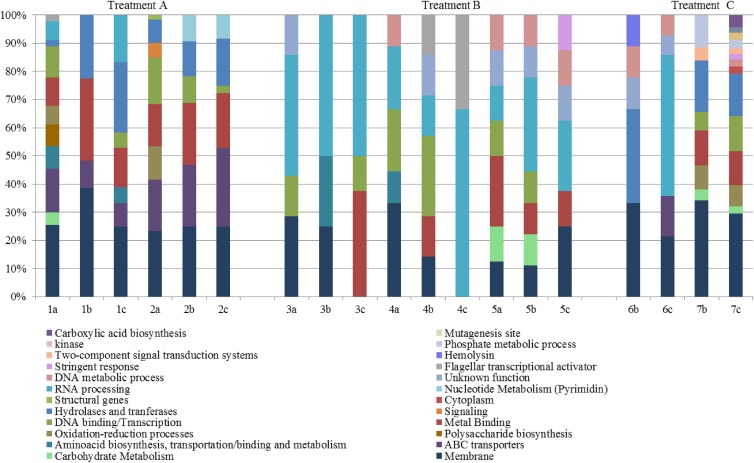
Fig 4.
Functional groupings of the nonconsistent mutations among all population mutations. The graph shows the different functional categories (using KEGG and GO terms) of the genes affected that displayed no consistent mutations (to any treatments). The percentages correspond to the amount of mutated genes that fell into each functional category. Enrichment analysis was performed with DAVID v.6.7.

