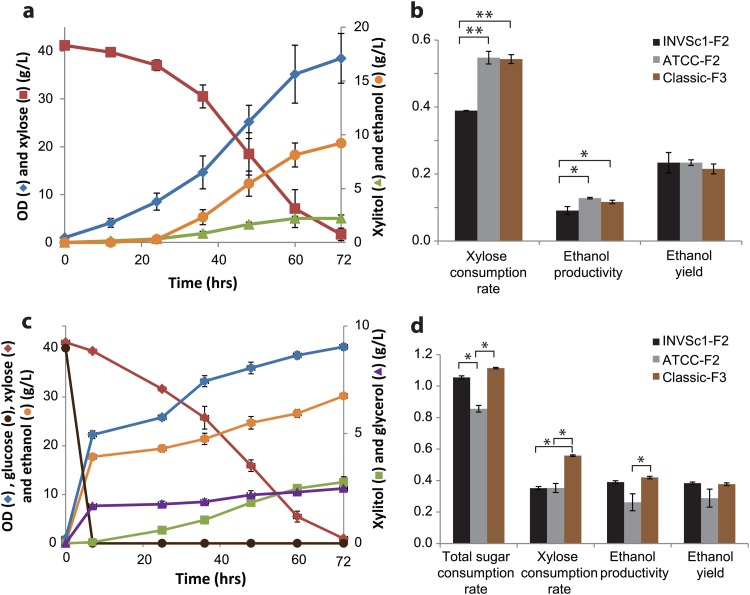
Fig 5.
Xylose fermentation and cofermentation with glucose of the screened recombinants. (a and b) Xylose (4%) fermentation profile of ATCC 4124-F2 and comparison between selected recombinants of the three strains. (c and d) Glucose (4%) and xylose (4%) cofermentation profiles of Classic-F3 and comparison between selected recombinants of the three strains. In panels b and d, the unit for the consumption and production rate was g/liter/h and the unit for the ethanol yield was g/g sugar consumed. The error bars represent standard deviations (n = 3). Statistical significance: *, n = 3, P < 0.05; **, n = 3, P < 0.005.

