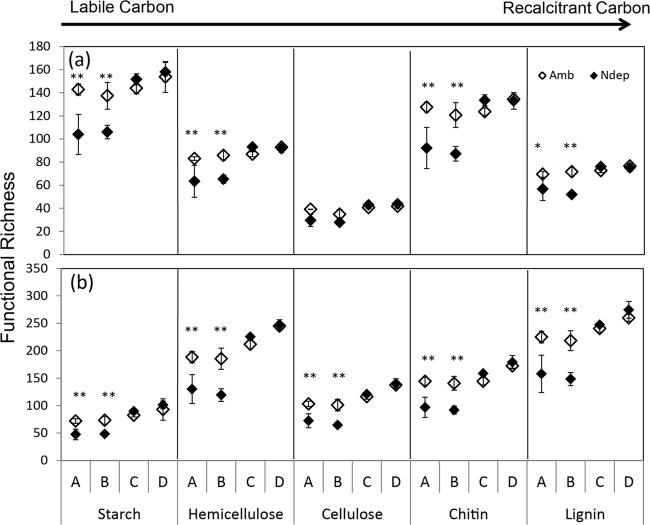
Fig 3.
Functional richness at each site, A to D, as the sum of all detected genes within each C substrate category for actinobacteria (a) and fungi (b). The error bars represent standard errors. N deposition decreased the total signal intensity for each substrate, except for actinobacterial cellulose-degrading genes, across all sites with a treatment effect (P < 0.04), site effect (P < 0.005), and interaction (P = 0.07 to 0.006). **, protected Fisher's LSD, P < 0.025; *, P < 0.05.

