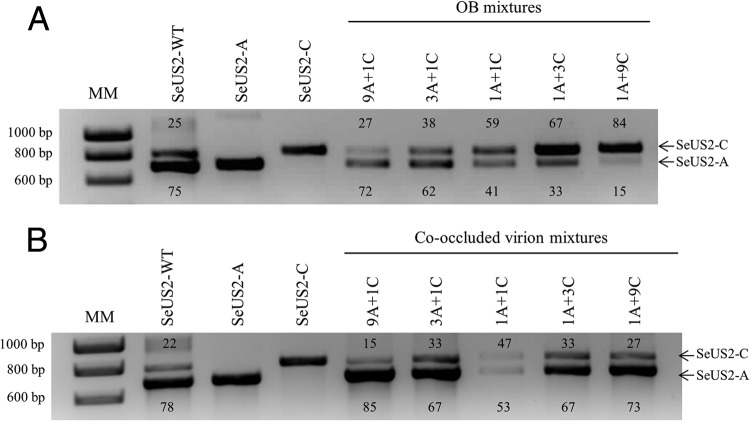
Fig 2.
Relative proportions of SeUS2-A and SeUS2-C in mixtures of OBs and occluded virions. Semiquantitative densitometric analysis of PCR products specific for SeUS2-A (691 bp within the variable region) and SeUS2-C (791 bp flanking the SeUS2-C deletion) in the OB mixtures (A) and co-occlusions (B). For amplification, the total DNA of the wild-type, pure genotypes SeUS2-A and SeUS2-C, and mixtures of OBs and co-occluded genotypes were used. The figures next to amplicons indicate the relative proportion of each product as estimated by densitometric analysis using the Scion Image program. The molecular marker (MM) used was a 1-kb ladder from Stratagene.

