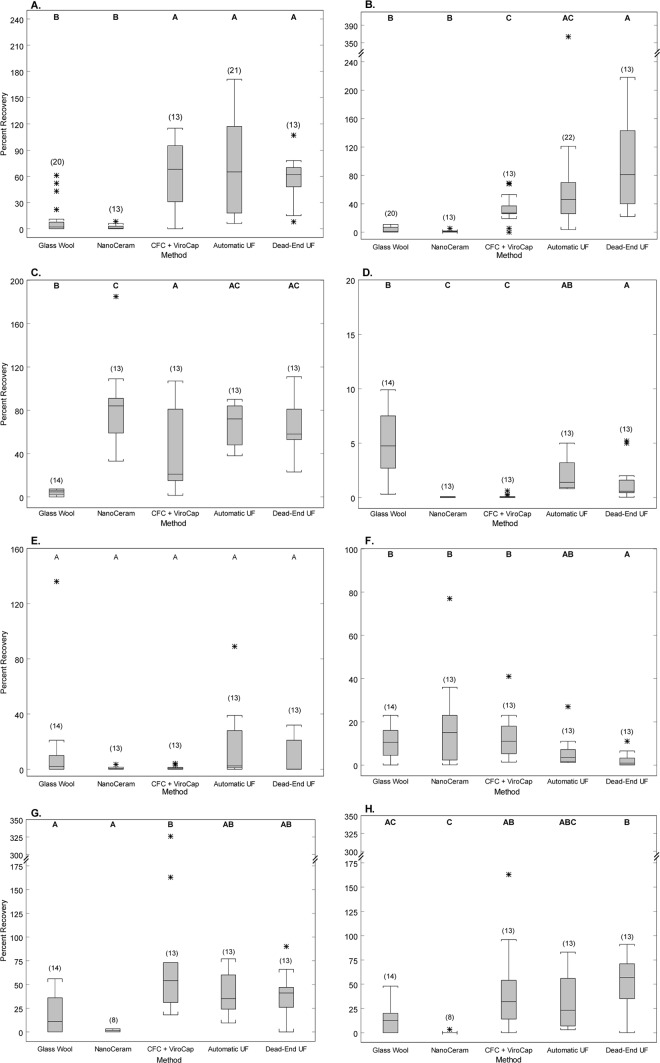
Fig 3.
Percent recoveries of viruses in lake water, 2010 to 2011. (A) E. coli, (B) enterococci, (C) MS2 coliphage, (D) adenovirus, (E) norovirus GII, (F) enterovirus, (G) Cryptosporidium, and (H) Giardia. The numbers of samples for each filtration method are indicated in parentheses. Each box includes the median concentration (center line) and the 25th and 75th percentiles (lower and upper box limits, respectively). Error bars represent data values less than or equal to 1.5 times the interquartile range outside the quartile. Asterisks indicate outlier values greater than 1.5 times the interquartile range outside the quartile. Results of the Tukey-Kramer multiple-comparison tests are presented as letters, and recoveries with at least one letter in common do not differ significantly. Note the different scales for percent recoveries for different microorganisms.

