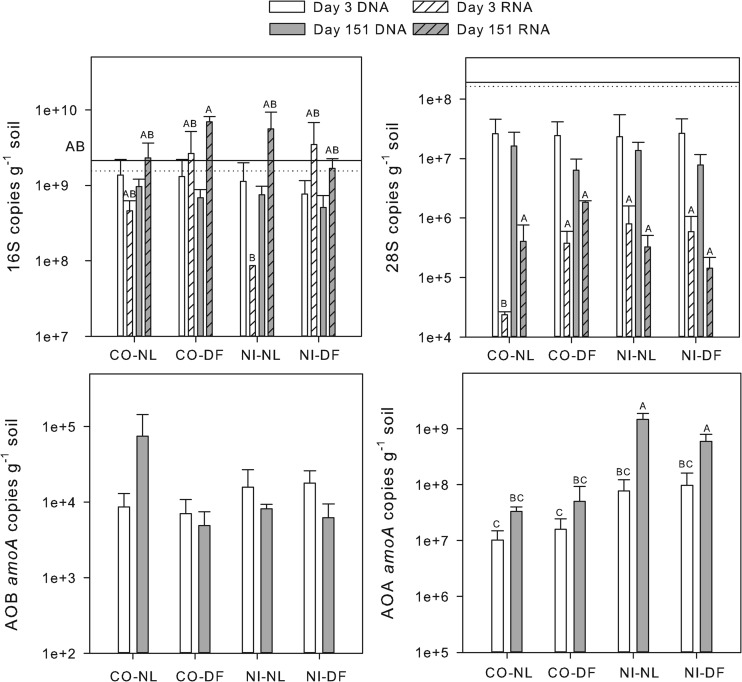
Fig 1.
Gene abundance and ribosomal abundance for bacteria (16S), fungi (28S), ammonia-oxidizing bacteria (AOB), and ammonia-oxidizing archaea (AOA). Lines on the 16S and 28S graphs indicate the gene copy numbers in freshly sieved control (solid line) and no-input (dotted line) soils. Dashed lines in the AOB and AOA graphs show the assay detection limits (note that all amoA mRNA values were below detection). Treatments include control/no litter (CO-NL), control/Douglas-fir (CO-DF), no input/no litter (NI-NL), and no input/Douglas-fir (NI-DF). Bars represent treatment means (n = 3) with standard errors. Letters indicate significant treatment effects (P < 0.05).

