
Fig 2.
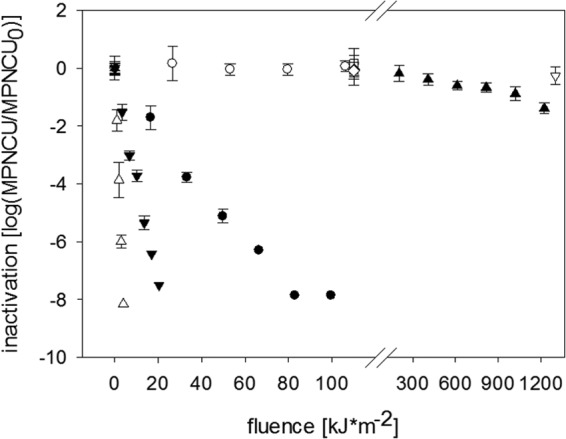
Inactivation kinetics of HAdV treated with UVA light (○), UVA+RB (●), full sunlight spectrum (▼), UVC light (△), and SODIS (full-spectrum illumination of sample in a PET bottle) (▲). Also shown are the corresponding dark controls (♢ and ▽) and RB-free controls (□). Error bars indicate standard deviations calculated from triplicate samples.