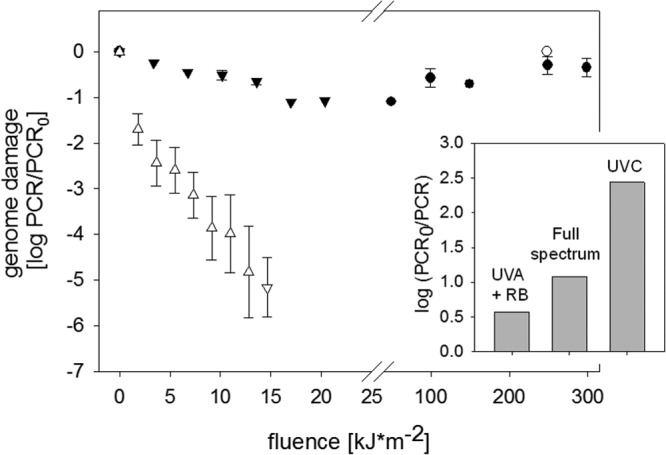
Fig 3.

Decrease in PCR signal upon HAdV inactivation at different fluences. Symbols correspond to UVA light (○), UVA+RB (●), full sunlight spectrum (▽), and UVC light (△). The PCR signal corresponds to the average signal of the two amplicons considered. Error bars indicate the upper and lower measurements obtained by the two amplicons. The inset shows a comparison of the genome damage incurred upon a 7-log10 inactivation by indirect solar disinfection (UVA+RB), the full solar spectrum, and UVC light.
