
Figure 3.
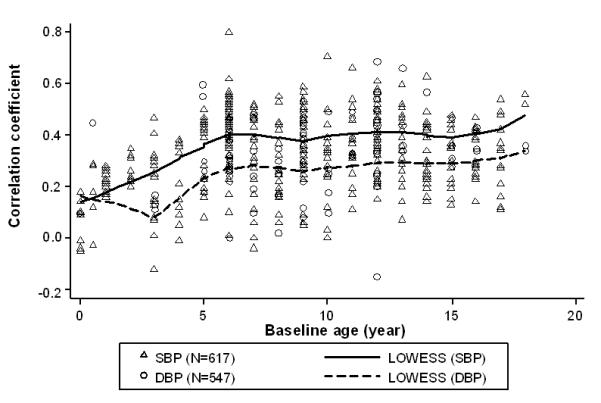
Scatter plot and smoothed curves of systolic and diastolic blood pressure (SBP/DBP) tracking correlation coefficients against baseline age*
*Smoothed curves were fit through locally weighted regression models (LOWESS) with a bandwidth of 0.40.