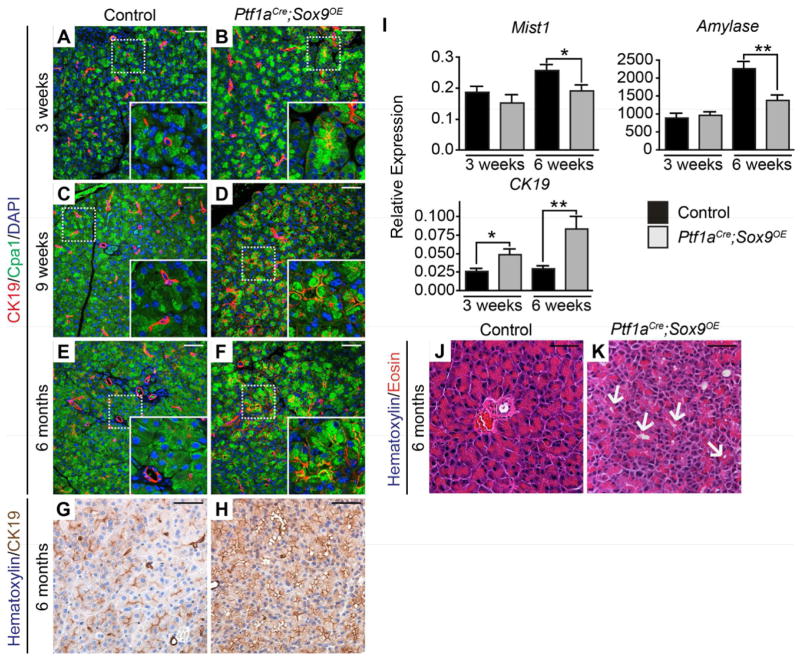
Figure 5. Sox9 misexpression induces ductal genes.
(A–F) Co-immunofluorescence staining for Cpa1 and CK19 shows CK19+Cpa+ cells in Ptf1aCre;Sox9OE mice (B, D, F), but not in controls (A, C, E). (G–H) Immunohistochemistry for CK19 reveals greater staining intensity in 6-month-old Ptf1aCre;Sox9OE than in control mice. (I) QRT-PCR analysis of Mist1, amylase and CK19 in whole pancreas RNA from Ptf1aCre;Sox9OE and control mice (n=5). (J, K) H&E staining shows acinar clusters with dilated lumens in 6-month-old Ptf1aCre;Sox9OE mice (K, arrows). Values are shown as mean ± s.e.m. *P<0.05 and **P<0.01. Scale bars: 50μm.

