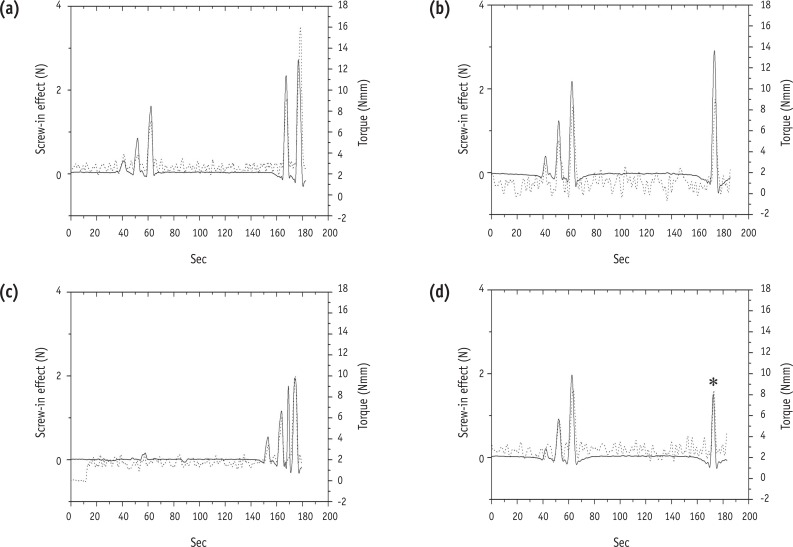
Figure 2.
The typical strip-chart recording the screw-in effect (solid line) and torque (dotted line) during preparation. (a) Group 1: #13 glide path; (b) Group 2: #15 glide path; (c) Group 3: #18 glide path; (d) Group 4: #20 glide path. At the moment the screw-in occurred, the torque value suddenly increased. After that, the torque value returned to the baseline. In most groups, the screw-in effect and torque increased as the file approached apical foramen. Exceptionally in group 4, the screw-in effect and torque decreased within 1 mm from the apical foramen (Asterisk).

