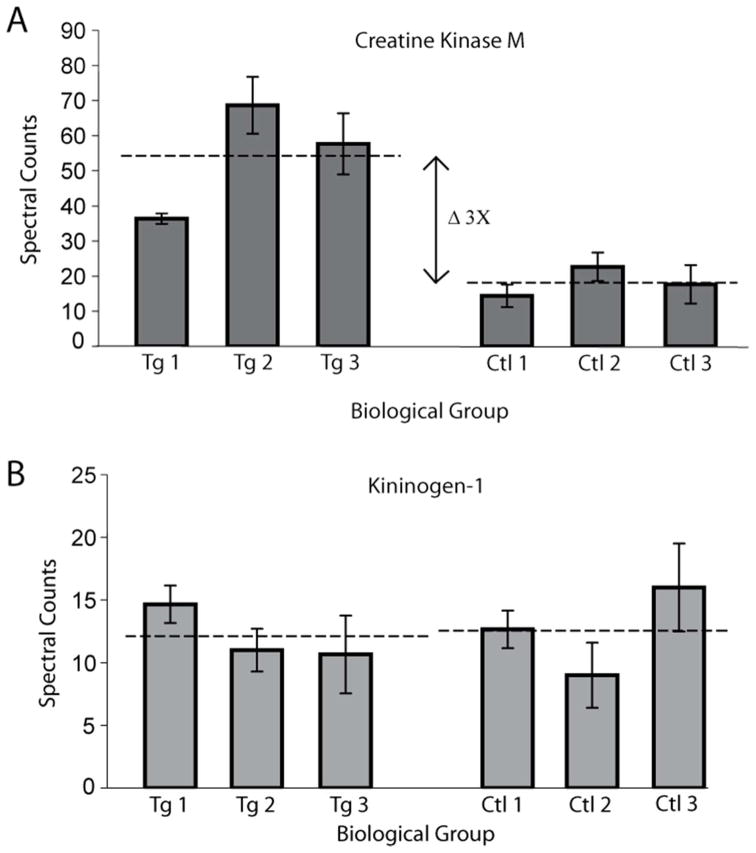
Figure 4.
Assessment of technical replicate variability between biological replicates. The error bars in both A and B are the standard deviation derived from the technical triplicates for each biological replicate. Panel A shows creatine kinase M having more or equal variability in the biological triplicates than each technical triplicate. The means of the biological triplicates are illustrated by the dashed line. Panel B represents kininogen-1 which is unchanged between control (Ctl) and transgenic (Tg) samples. The biological variability coupled with the technical replicates provides a barely noticeable difference in the pooled mean between control and transgenic spectral counts. The difference in means is contrasted with the three fold change observed from creatine kinase M (A).

