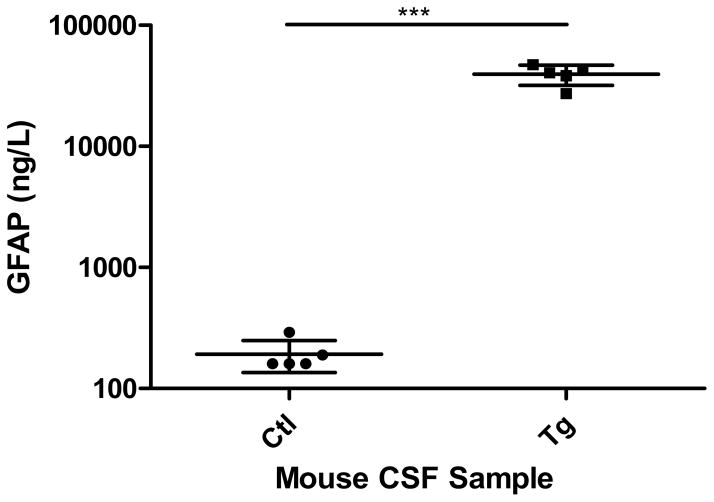
Figure 6.
Validation of MS spectral counts using a GFAP ELISA. GFAP content (ng/L) measured within mouse CSF from both transgenic and control animals. The data represents the average with standard deviation (n=5, each sample represents pooling of 1 to 8 animals). The statistics are performed using a student t-test, p<0.0001.

