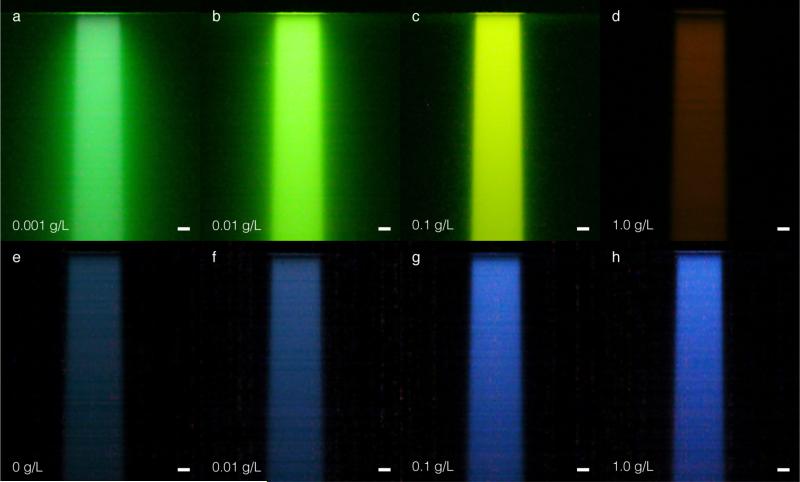
Figure 4.
In (a) – (d) raw white light images captured with a commercial CMOS camera for Fluorescein at the indicated increasing concentrations. In (e) the captured raw white light image of Čerenkov emission induced in the water tank in the absence of a fluorescent dye. In (f)– (h) raw white light images for increasing concentrations of Quinine Sulfate. The bars in (a) – (h) represent 1 cm.

