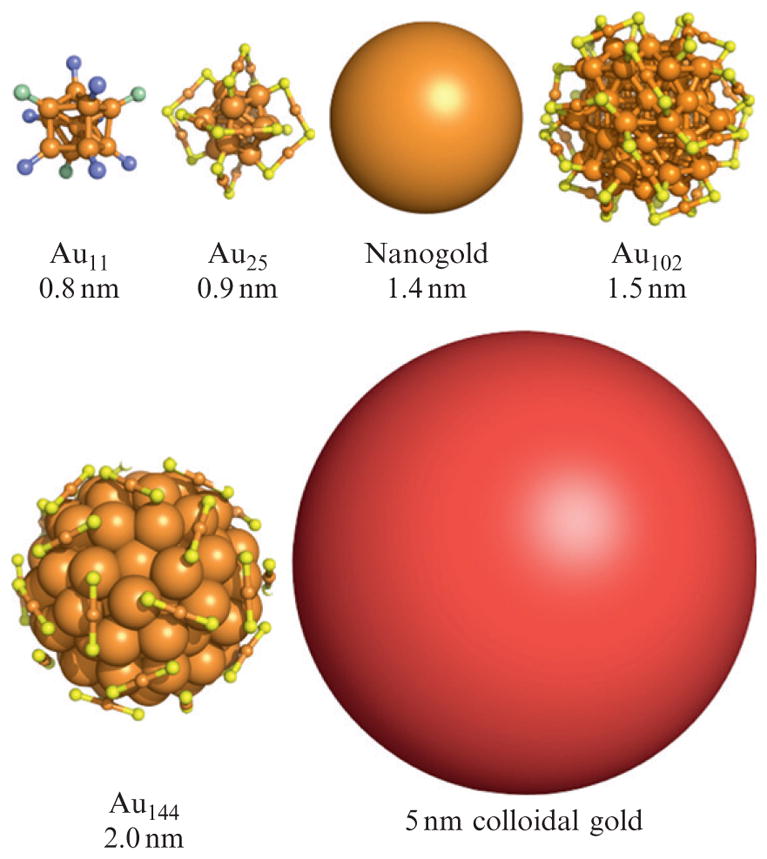
Figure 9.1.

Representative inorganic gold clusters. The organic components of the ligand layer of each cluster are not shown. Orange, yellow, purple, and green represent gold, sulfur, phosphorous, and chlorine, respectively. The images of Au11, Au25, and Au102 are created from X-ray crystallographic coordinates. The image of Au144 is from a density functional theory model (Lopez-Acevedo et al., 2009). A 5-nm diameter colloidal gold particle is shown for comparison.
