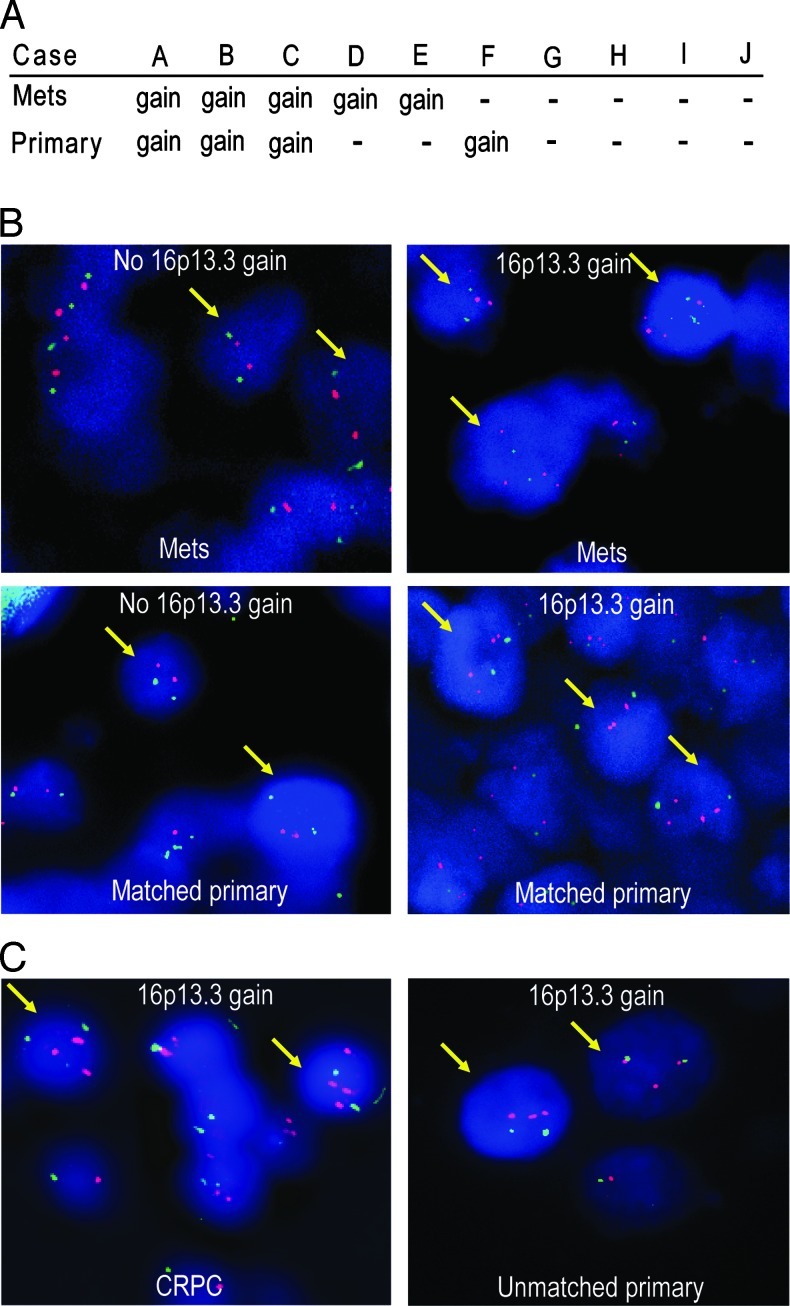
Figure 1.
Dual-color FISH analysis of 16p13.3 gain in formalin-fixed paraffin-embedded PCa samples. (A) Results of interphase FISH for chromosome 16p13.3 on 10 LN metastases (A–J) and their matched primary tumors. (B) On the left panel, representative FISH images of LN metastases without gain and their matched primaries show two red signals (16p13.3 locus) and two green signals (centromere 16) in most of the nuclei. On the right panel, FISH images show greater than or equal to three red signals (16p13.3 locus) and two green signals per nucleus, indicating a 16p13.3 gain. (C) Representative images of the 16p13.3 gain in a CRPC sample (left panel) and in a sample from the 46 unmatched primary tumors (right panel).

