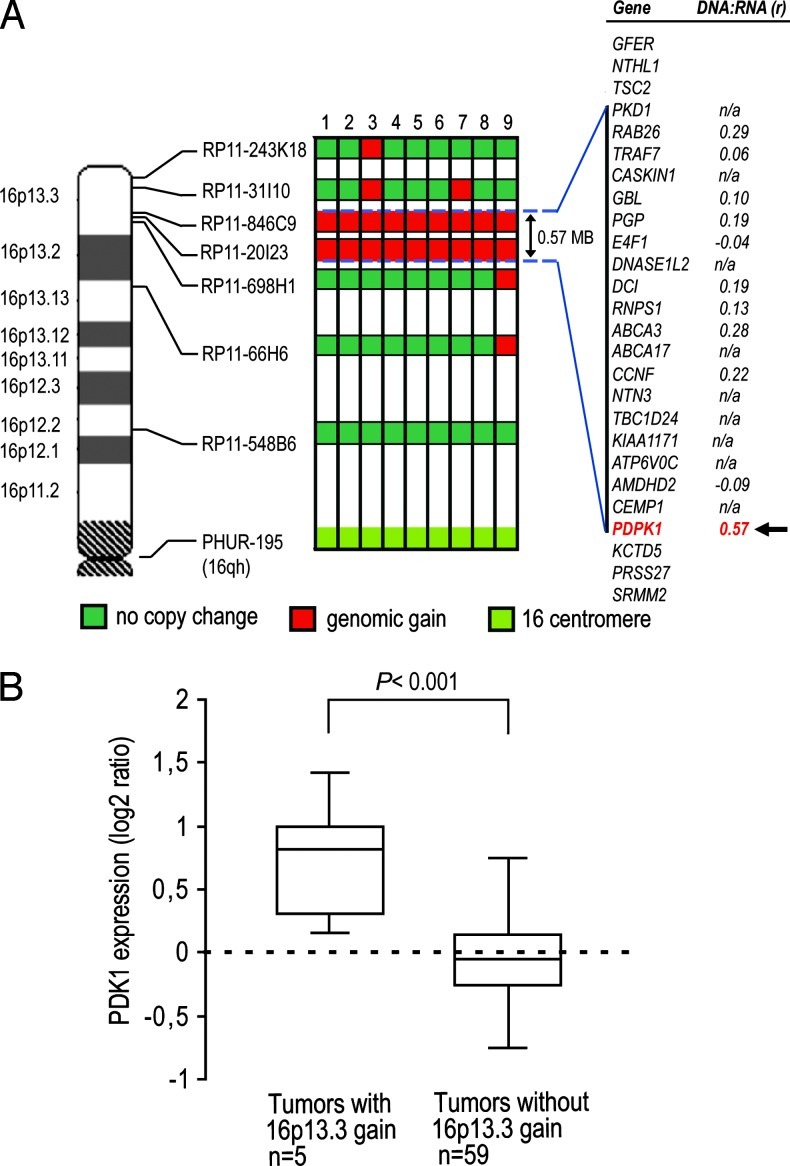
Figure 2.
Mapping of flanking regions of the 16p13.3 gain and PDK1 transcript levels in PCa samples. (A) Each BAC probe was cohybridized with the centromere 16 probe to nine primary formalin-fixed paraffin-embedded PCa samples with 16p13.3 gain detected by FISH. Gains are indicated by red boxes for each sample. The horizontal dotted lines delineate the minimal region of gain with, on the far right, the list of genes mapping to this region (UCSC Genome Browser, February 2009 assembly) with their corresponding DNA/ RNA correlation coefficient calculated from independent and previously published array-CGH and gene expression data sets [13,16]. (B) PDK1 transcript levels measured in previously published micro-array data [16] are increased in tumor samples with 16p13.3 gain compared with samples without 16p13.3 gain [13]. Box plots show 25th, 50th (median), and 75th percentiles as well as maximum and minimum of sample set expression with P value (two-sided Mann-Whitney U test). Values are reported as log2 ratios, normalized to the sample set mean.

