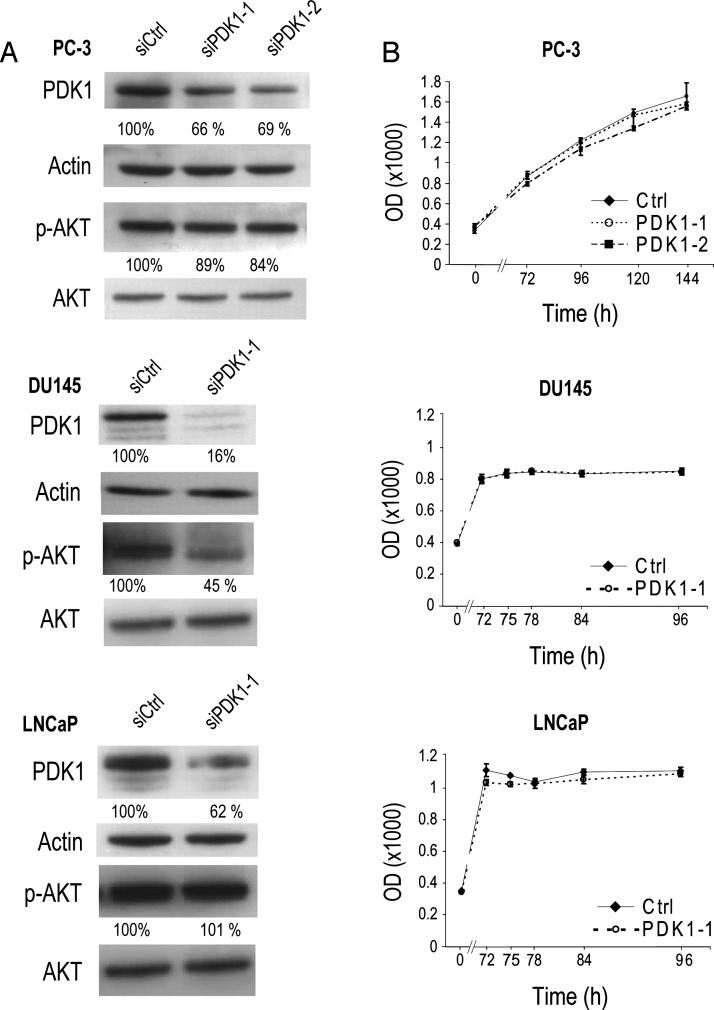
Figure 5.
PDK1 knockdown and PC cell growth. (A) Accompanying Western blots of the experiments shown in Figure 4. Residual expression (percentage relative to siCtrl and normalized to actin) is indicated for PDK1 and p-AKT (relative to siCtrl and normalized to AKT). (B) The effect of PDK1 knockdown on growth in PCa cell lines. MTT assays were performed on PC-3, DU145, and LNCaP cells, on the day of transfection (0 hour) and 72 hours post-transfection at time intervals indicated. Cells were transfected with control (siCtrl), siPDK1-1, or siPDK1-2. Differences between control and PDK1-targeting siRNA were not significant with P ≥ .83.

