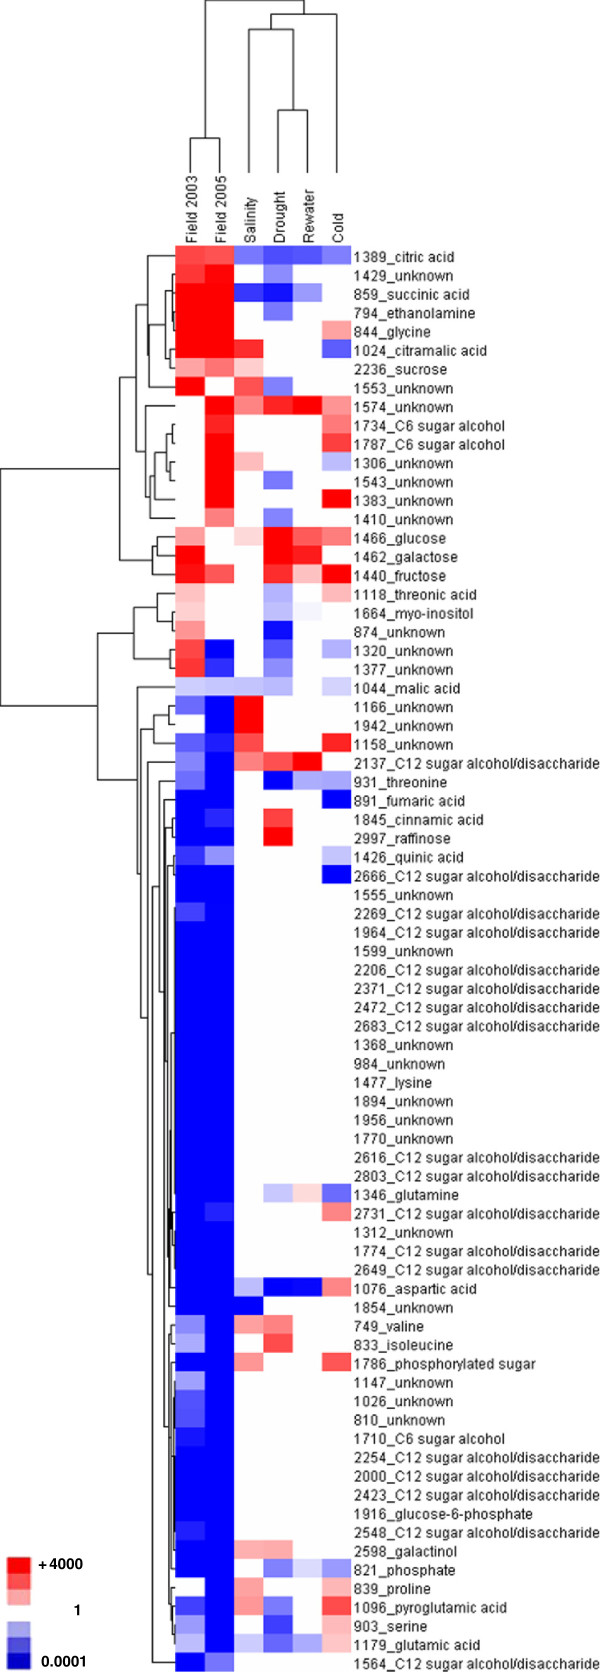
Figure 5.
HCA of metabolites in Thellungiella harvested from the Yukon field site in 2003 and 2005 and chamber grown plants exposed to abiotic stresses. Illustrated is a heat-map of an HCA using 76 MSTs showing differential abundance between field and cabinet stress treatment plants over cabinet controls. For inclusion, a given MST was either found in profiles of leaf extracts for both field years or in the profiles of extracts in a single field year in cases where the same MST was found in profiles of stressed, cabinet-grown plants. The mean MST abundance was expressed as the fold ratio of treated or field over cabinet control levels. Those ratios that exceeded 1.5 or were lower than 0.67 were then log10 transformed before being subjected to HCA and illustrated as a heat map. Colors and legends as per Figure 3.

