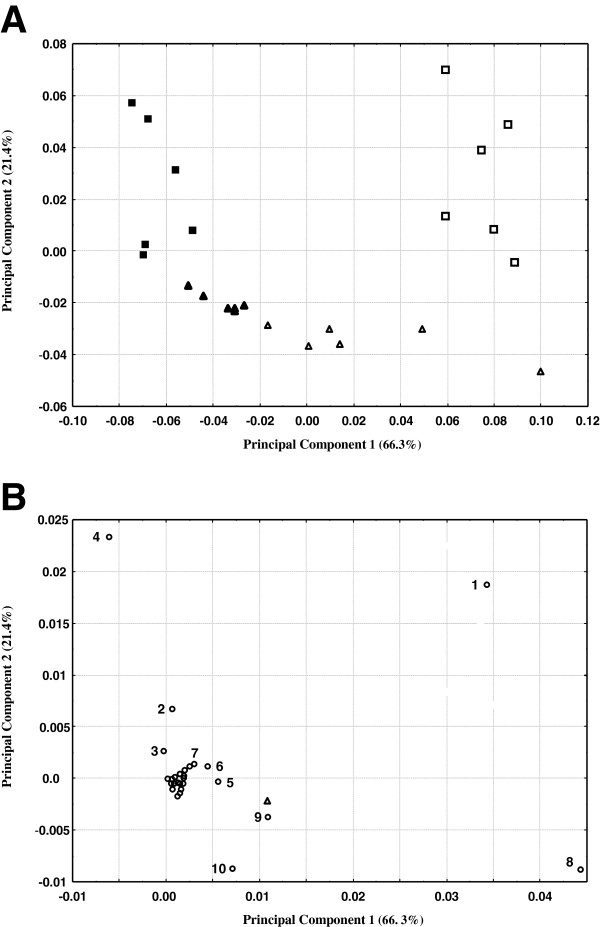
Figure 8.
Principal component analysis of 49 MSTs differing in relative abundance following plant exposure to HN, LN, HN + S, or LN + S conditions. A) Sample measurements for each treatment consisted of 3 biological replicates of extracts from pooled seedling shoot tissue analyzed in duplicate. Each point represents the dataset comprised of 49 MSTs in these six analyses and is positioned on a biplot of principal component 1 vs. 2. (■ = HN, □ = HN + S, ▴ = LN, ▵ = LN + S. B) Projections of metabolite variables onto the principal components described in A. Numbered metabolites are: 1 = proline, 2 = serine, 3 = threonine, 4 = pyroglutamic acid, 5 = unknown 1429, 6 = fructose, 7 = sugar 1579, 8 = myo-inositol, 9 = sugar 2100 and 10 = raffinose.

