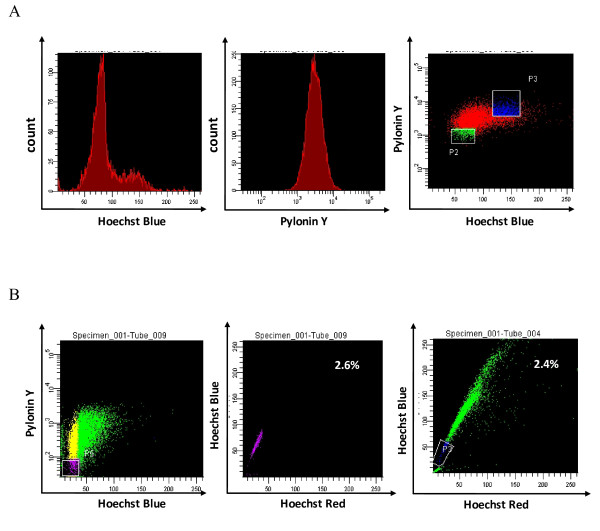
Figure 2.
Most cells in the G0 phase sorted by fluorescence-activated cell sorting (FACS) also resided in the same region as side-population cells. (A) Hoechst-Pyronin Y (PY)-based FACS. The left and middle panels separately represent the Hoechst-staining control group and PY-staining control group. In the Hoechst-PY-staining group (right), the P2 population represents the cells residing in G0 phase, and P3, cells in S phase. (B) G0 cells sorted by Hoechst-PY-staining-based FACS (left panel) were measured by side-population analysis, and the result is shown in the middle panel. The right panel represents the classic side-population analysis of CT-26 cells. The middle and right panels show that most of the cells in G0 phase also resided in the region of the side-population cells. Experiments were repeated three times with similar results.

