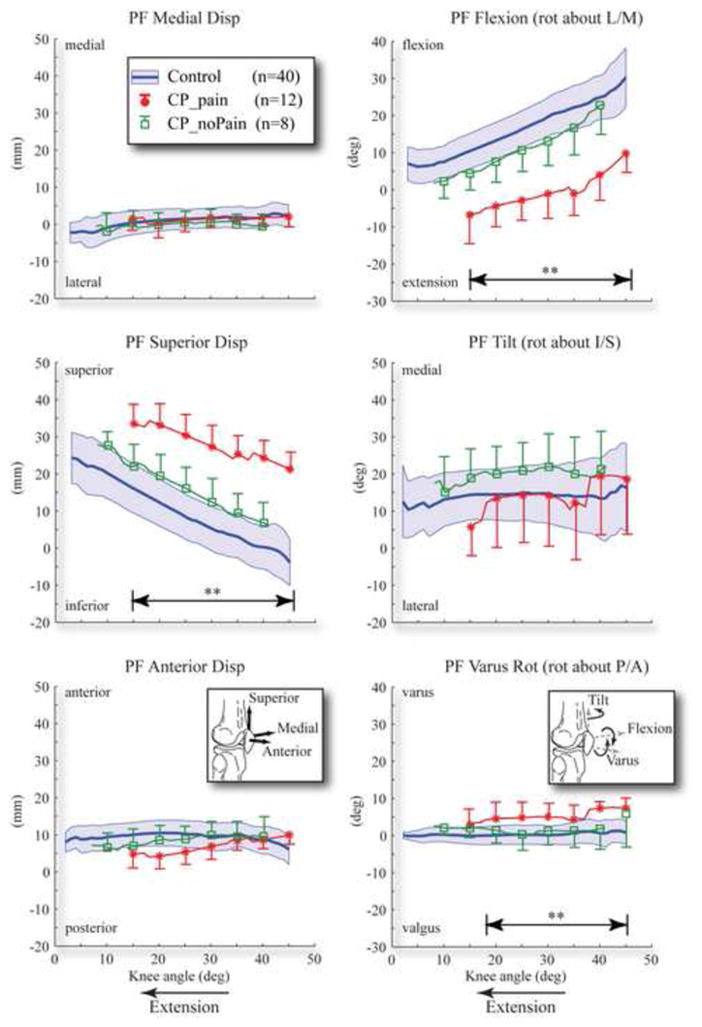
Figure 3. Comparison of patellofemoral kinematics between the cerebral palsy subgroups.

Double arrow lines with ** above denote the ranges where there are significant differences between subgroups. The control cohort is represented by a solid line with one standard deviation range shown in a shaded area. The cerebral palsy subgroups without AKP and with pain (CP_noPain and CP_pain) are represented by solid lines with a hollow square symbol and solid circular symbol, respectively. One standard deviation bar provided every 5°.
