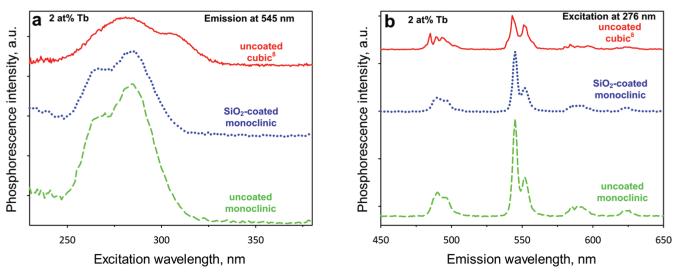
Figure 3.
(a) The excitation spectra of the 2 at % Tb-doped Y2O3 uncoated cubic (solid line), uncoated monoclinic (broken line), and SiO2-coated monoclinic (blue line) nanoparticles monitored at 545 nm. The two bands around 280 and 310 nm are attributed to Tb3+ transitions. (b) Emission spectra of the same samples under 276 nm excitation. The appearing peaks correspond to Tb3+ ion transitions, with the most dominant being the one at 545 nm attributed to the 5D4 → 7F5 transition.

