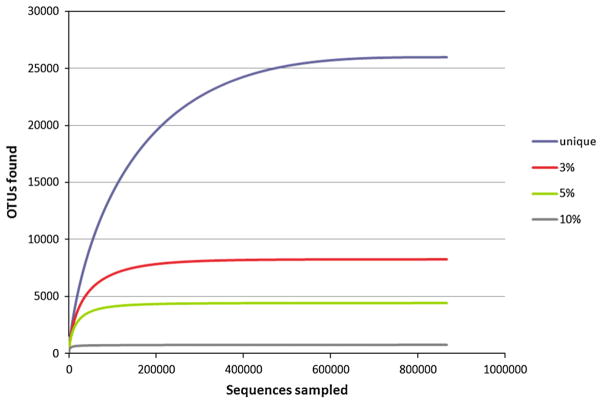
Fig. 3.
Rarefaction analysis of the oral metagenome. The curves include only sequences which occur 3 or more times. The number of OTUs with different cutoff values was plotted as a function of the number of sequences sampled. OTUs with ≥97%, ≥95% and ≥90% pairwise sequence identity are arbitrarily assumed to form the same species, genus and family, respectively.

