
Fig. 3.
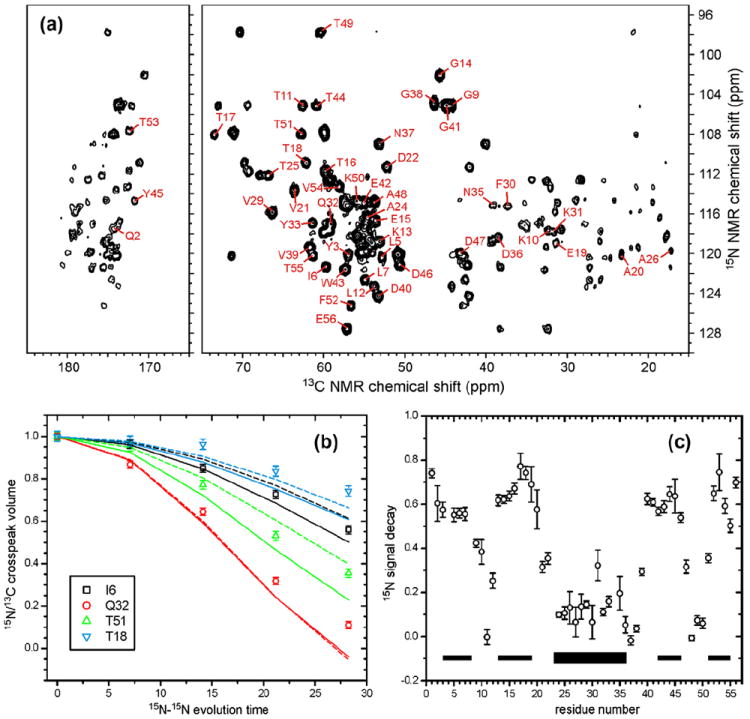
(a) 2D 15N–13C correlation spectrum of microcrystalline, uniformly 15N, 13C-labeled GB1, obtained at 14.1 T using the pulse sequence in Fig. 2a, with M = 0, N = 8, n = 16, and τR = 73.53 μs. Crosspeaks from which 15N-BARE decay curves were extracted are indicated with their residue-specific assignments. (b) Representative 15N-BARE decay curves. Solid and dashed curves are simulations using backbone torsion angles from PDB 2GI9, before (solid) and after (dashed) refinement against the 15N-BARE and 13C-BARE data as described in the text. Experimental data and simulations are normalized to 1.00 at zero evolution time. (c) Signal decay at the maximum evolution time for all residues with measureable 15N-BARE curves. Thin and thick bars indicate β-strand and α-helix segments in GB1, respectively.