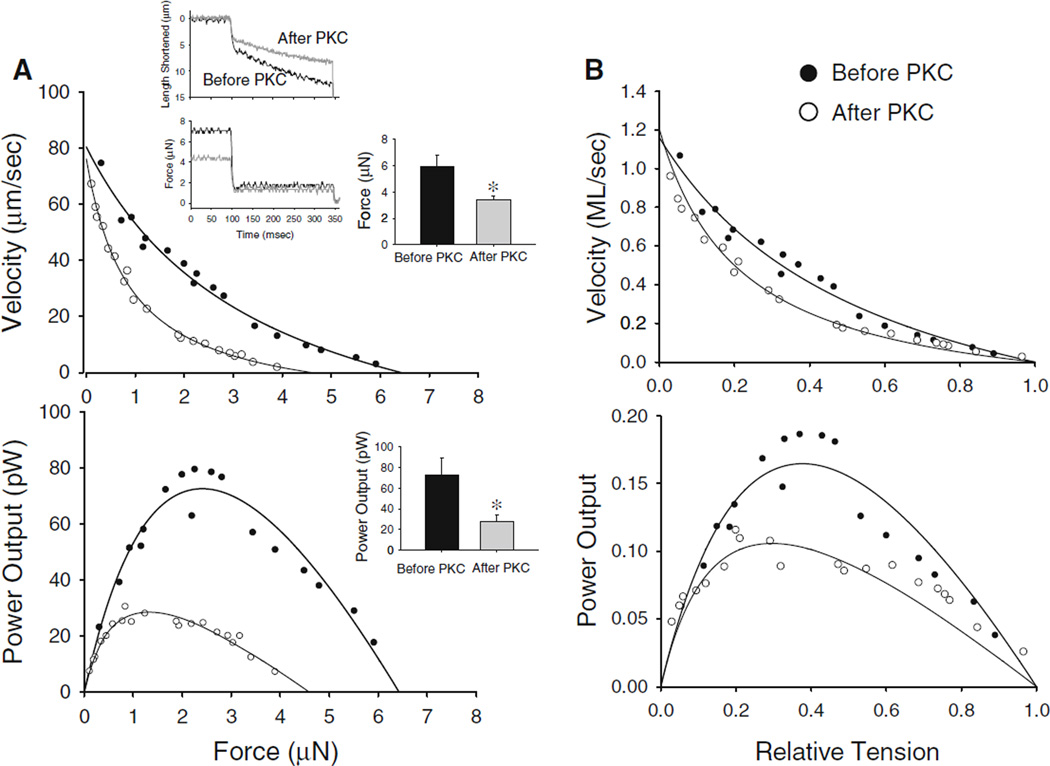
Fig. 1.
a. Absolute force–velocity (top) and power-load curves (bottom) from a cardiac myocyte preparation (date: 08/30/06) activated at a submaximal [Ca2+] (pCa 5.9) before (closed circles) or after treatment with the catalytic subunit of PKC (open circles). b. Normalized force–velocity and power-load curves from myocytes activated at submaximal Ca2+ levels before or after treatment with the catalytic subunit of PKC. Inset shows myocyte length (top) and force (bottom) traces during load clamps before PKC (black) and after PKC (grey). Bar plots show mean force and power output values before and after PKC. (mean ± SD, N = 7, *p < 0.05)

