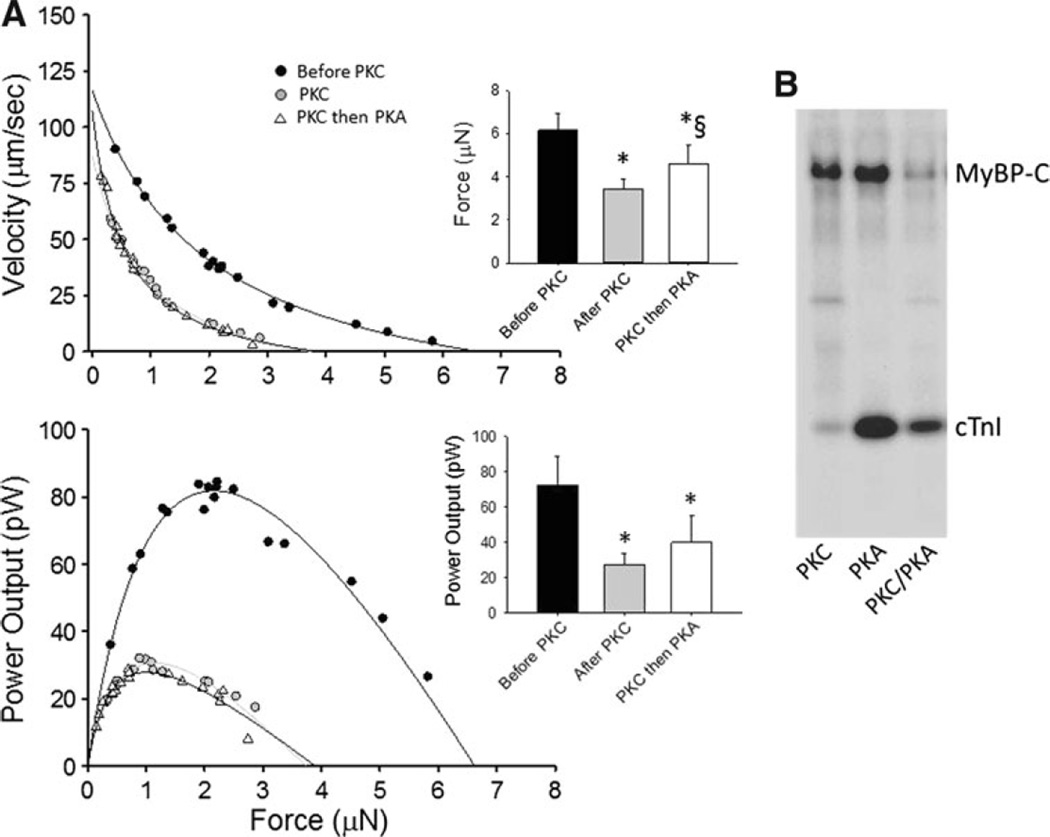
Fig. 3.
a. Absolute force–velocity and power-load curves from a myocyte preparation (date: 12/07/06) before PKC, after PKC, and then PKA in the presence of PKC during submaximal Ca2+ activations. PKC decreased myocyte force and power generating capacity. Power output remained depressed even after PKA, implicating PKC effects predominates over PKA on myocyte power generating capacity. Bar plots show mean ± SD force and power output values before PKC, after PKC, and after PKC then PKA (*p < 0.05 versus before PKC, § p < 0.05 versus after PKC). b. Autoradiogram of 1 µg permeabilized cardiac myocytes incubated for 1 h with the catalytic subunits of PKC (0.5 µg/mL) in the presence of 12.5 µCi [32P]-ATP (lane 1), PKA (5 µg/mL) in the presence of 12.5 µCi [32P]-ATP (lane 2), and PKC in the absence of radiolabelled ATP followed by PKA (lane 3) in the presence of 12.5 µCi [32P]-ATP. Consistent with the effects on power output, PKC attenuated the PKA-mediated phosphorylation of MyBP-C and cTnI

