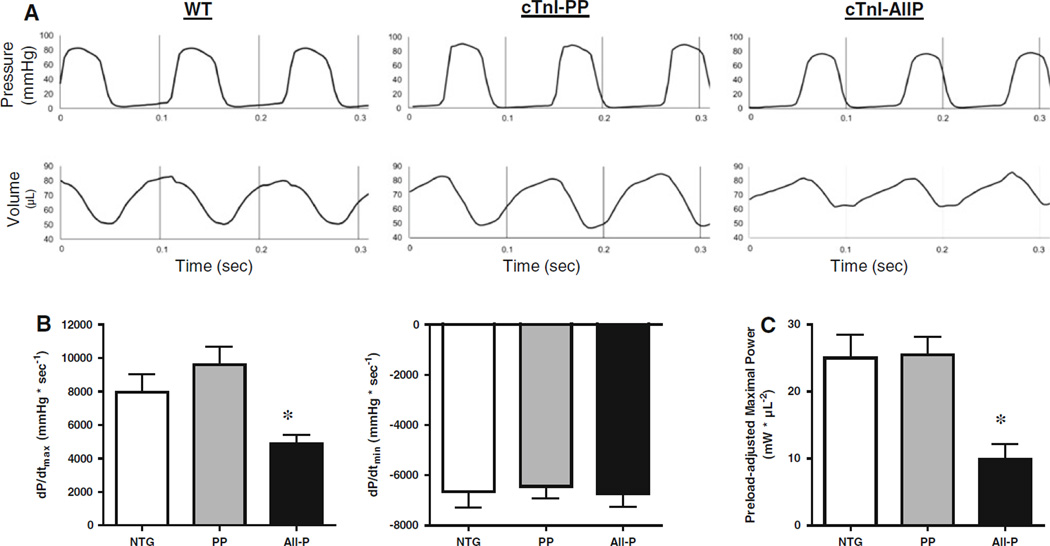
Fig. 6.
a. Representative pressure and volume tracings from WT, PP, All-P mice using in situ pressure–volume analysis. b. The maximum rate of heart contraction (+dP/dtmax) and relaxation (−dP/dtmin) were measured and All-P mice had reduced maximal rate of contraction with no change in relaxation parameters (*p < 0.05 verusu NTG; § p < 0.05 versus PP). c. Ventricular power output was depressed in All-P transgenic mouse hearts compared to WT and PP mouse hearts. (*p < 0.05 versus NTG; § p < 0.05 versus PP). All plots mean ± SD (n = 3–5)

