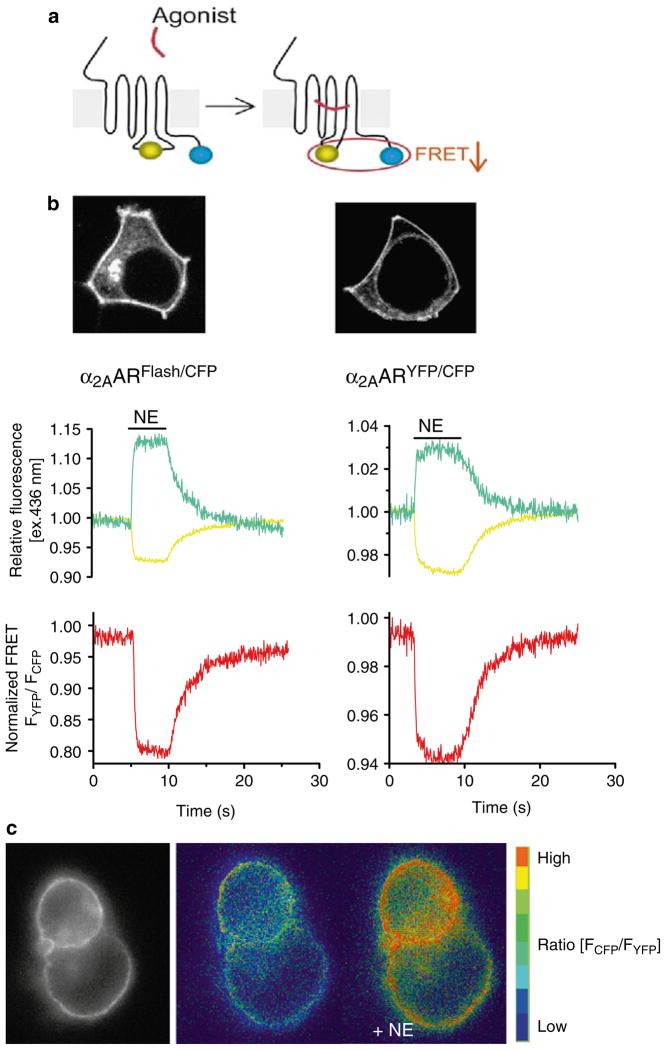
Fig. 2.
Comparing the CFP/YFP and FlAsh/CFP FRET pair constructs of the α2A-adrenergic receptor. (a) Design of a GPCR biosensor (blue circles CFP, greenish yellow circles YFP/FlAsH). GPCR activation is monitored by a decrease in FRET between CFP and YFP (or FlAsH) inserted in the third intracellular loop and C-termini of the receptor, respectively. (b) Upper panels; confocal pictures show the cellular expression of the α2A-AR Flash/CFP and α2A-AR YFP/CFP in transiently transfected HEK-293 cells. Note that both receptor constructs exhibit predominant localization to the plasma membrane. Lower panels; changes in the fluorescence of CFP and Flash (left ) or CFP and YFP (right ), and corresponding FRET ratio FYFP/FCFP in response to a saturating concentration of norepinephrine (NE; 100 μM) recorded from a single HEK-293 cell expressing α2A-AR Flash/CFP or α2A-AR YFP/CFP. Initial values of relative fluorescence (cyan traces for CFP, and yellow traces for YFP or Flash) and the FRET ratio (red traces) were set to one. The fractional decrease of FRET in response to NE reflects the intramolecular conformational switch accompanying receptor activation. Measurements were performed in single cells continuously perfused with buffer or with ligand for the time indicated by the horizontal bar. (c) FRET imaging of receptor activation in HEK293 cells transiently tranfected with α2A-AR CFP/YFP. The left panel shows the epifluorescence image and the next two panels present the pseudo-colored FRET ratio before and after stimulation by NE. Adapted from (9).

