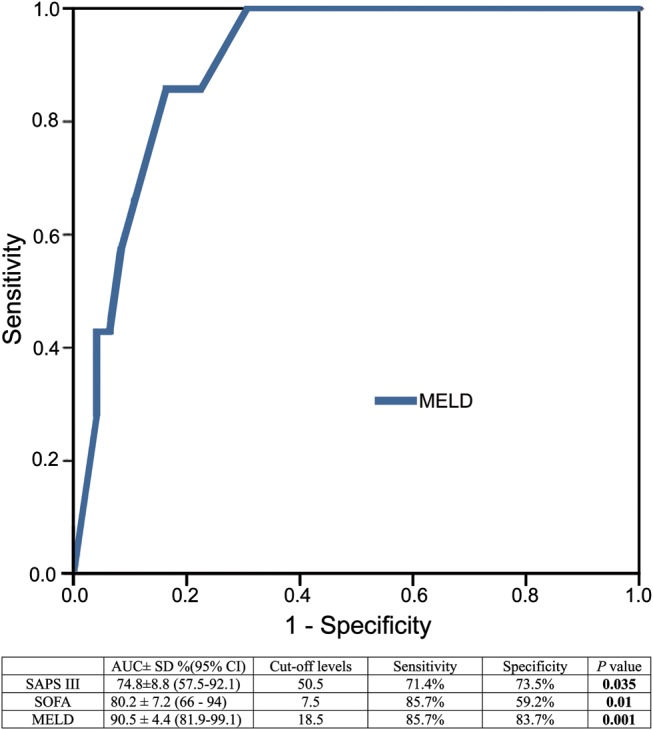
Figure 2:

ROC curve for MELD. Comparison of AUC for MELD, SAPS III and SOFA scores. AUC: area under curve; ROC: receiver operating characteristic curve; SAPS: simplified acute physiology score; SOFA: sequential organ failure assessment; MELD: model for end-stage liver disease score; NS: non-statistically significant. Results are expressed as mean ± standard deviation or percentage.
