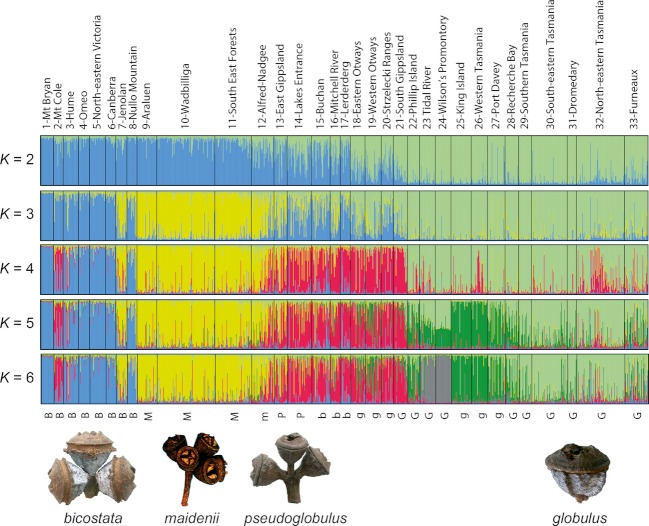
Figure 6.
Proportion of membership for 1200 individuals of the Eucalyptus globulus species complex. Each individual is represented by a thin vertical line, partitioned into K colored segments representing the individual's estimated membership into the K genetic clusters. Individuals are grouped by region/race (indicated above the figure), and the overall capsule morphology of core regions is shown below the figure.

