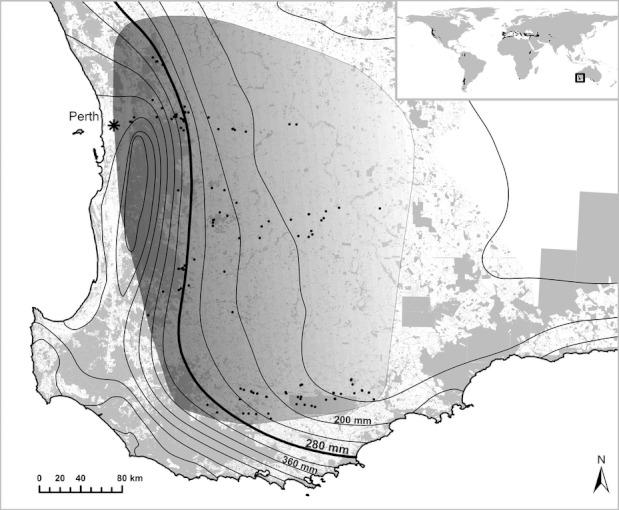
Figure 1.

The climatic and geographic range of wandoo across the southwest of Western Australia. The world map indicates Mediterranean climate regions, with black highlights representing Köppen climate symbols Csa and Csb following Peel et al. (2007), and the black square indicating the study region in Australia. Shaded central outline represents the wandoo range based on the point records from this study and the NatureMap database (DEC 2012). Black dots indicate the survey plots used in this study. Underlying gray fields indicate the remaining native vegetation cover in the region, with white indicating areas of human land use, predominantly agriculture. Lines indicate the 30-year average winter rainfall 40 mm stepped isohyets based on the annual rainfall data from 1976 to 2005. The bold 280 mm isohyet indicates the x-axis intercept of the linear relationship between winter rainfall and crown health change shown in Fig. 3b. Across its range, wandoo crown health was found to increasingly decline between 2002 and 2008 from higher (dark, left) to lower (light, right) rainfall zones.
