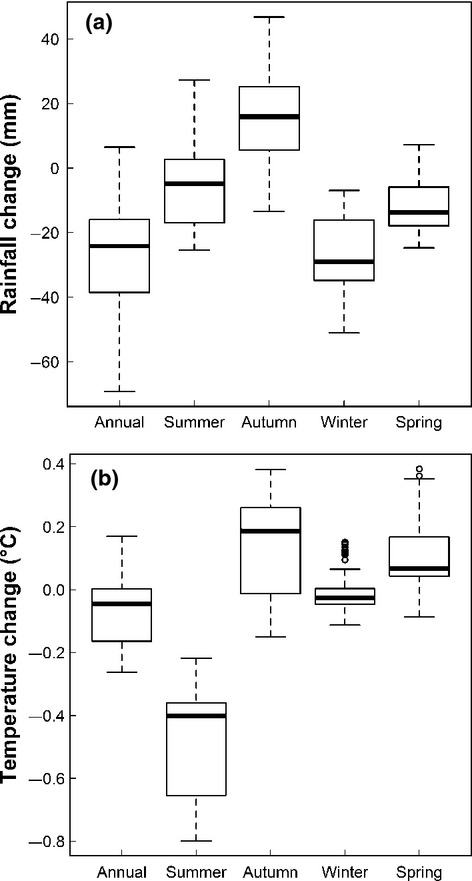
Figure 2.

Changes in rainfall (a) and temperature (b) for all wandoo plots (n = 115) calculated as average 2008 (2002–2007) minus average 2002 (1996–2001). The box plots indicate the median and range. Summer: Dec–Feb, Autumn: Mar–May, Winter: Jun–Aug, Spring: Sep–Nov.
