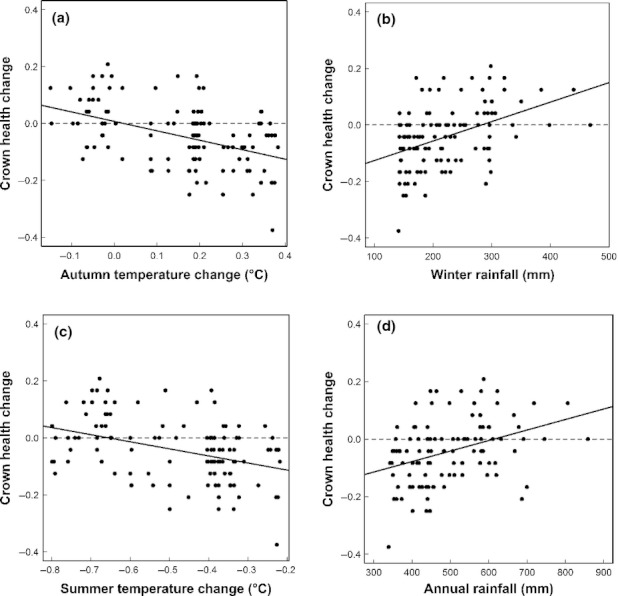
Figure 3.

Relationships between crown health change and individual climate-related variables. Graph (a) and (c) indicate crown health declines in areas where autumn temperatures increased (a) or summer temperatures showed only little decrease (c) between 2002 and 2008. Graphs (b) and (d) indicate crown health declines predominantly in areas with low 30-year average winter (b) and/or annual (d) rainfall. For related statistics, see Table 2.
