
Figure A2.
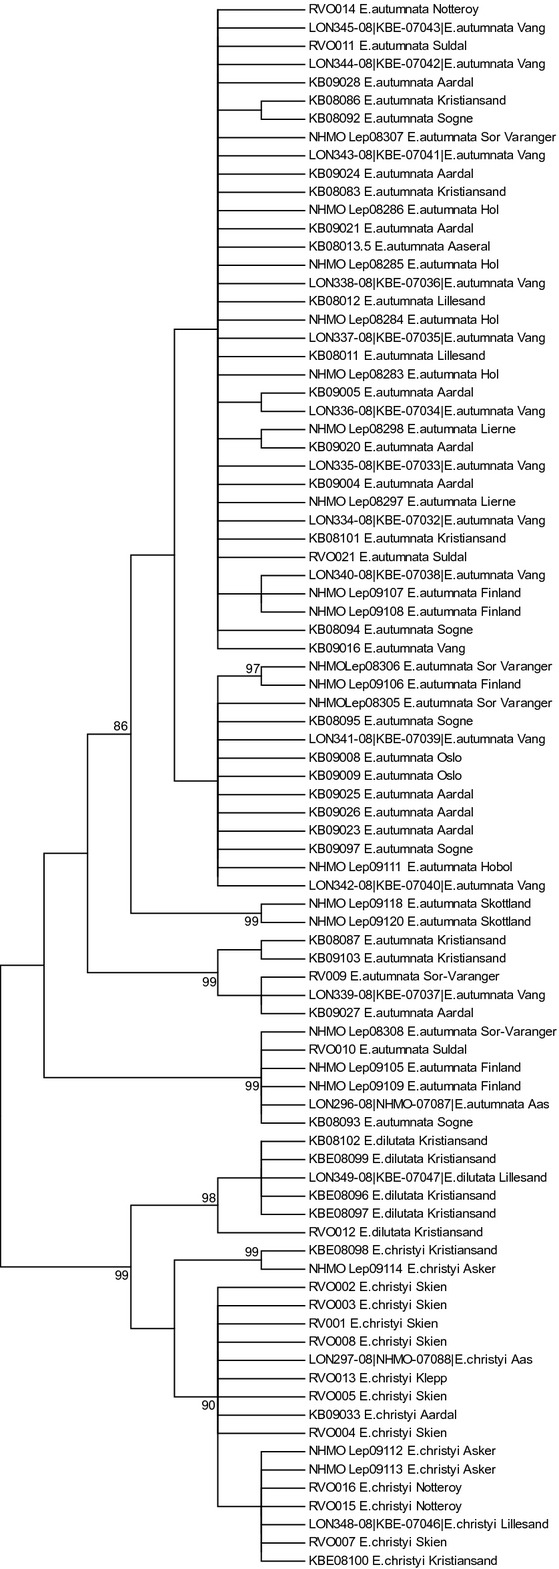
Maximum parsimony analysis (using the complete deletion option) of the COI data set (n = 86). MP analysis also shows high intraspecific variation within E. autumnata. Bootstrap values (500 iterations) are shown at each node.
Official websites use .gov
A
.gov website belongs to an official
government organization in the United States.
Secure .gov websites use HTTPS
A lock (
) or https:// means you've safely
connected to the .gov website. Share sensitive
information only on official, secure websites.
Maximum parsimony analysis (using the complete deletion option) of the COI data set (n = 86). MP analysis also shows high intraspecific variation within E. autumnata. Bootstrap values (500 iterations) are shown at each node.