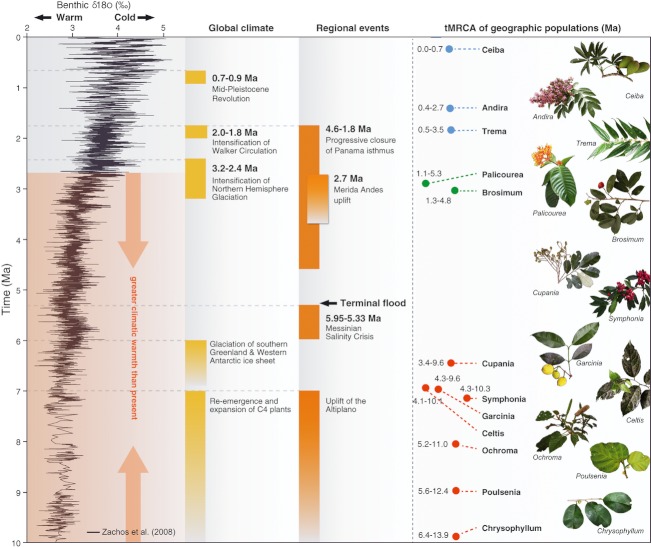
Figure 3.
tMRCA of geographic lineages and relevant corresponding surface air temperatures (Zachos et al. 2008) and climatic and geological events. Mean tMRCA estimates are shown in colored circles (Pleistocene blue, Pliocene green, Miocene red) accompanied by upper and lower 95% HPD intervals. Large vertical arrows indicate period in which average surface air temperatures were warmer than present. Tree photographs were provided by Center for Tropical Forest Sciences.

