
Figure 2.
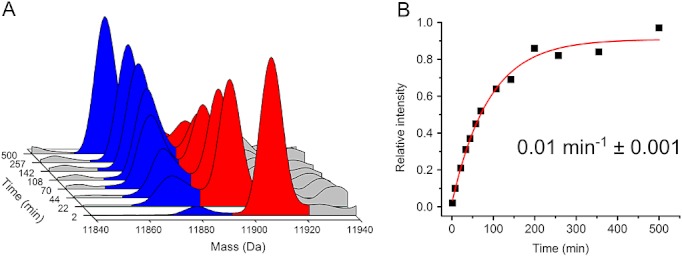
HDX-ESI-MS of wild-type β2m. (A) D→H exchange of wild-type β2m (pH 7.0, 37 °C). Protein molecules which have undergone exchange via an EX2 mechanism only are shown on the right in red, while those which have undergone exchange via both an EX2 and EX1 mechanism are shown on the left in blue. (B) Plot showing the intensity of the EX1 peak relative to the total protein signal over time. The data are fitted to a single exponential (red line).