
Figure 3.
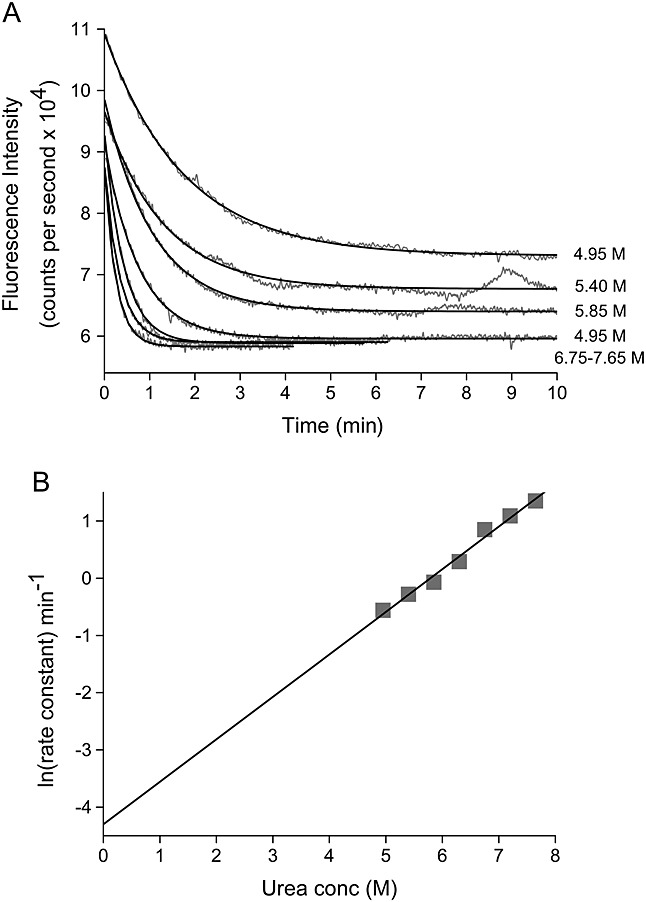
Determination of wild-type β2m unfolding rate. (A) Plot showing the unfolding of wild-type human β2m measured using tryptophan fluorescence (pH 7.0, 37 °C) at increasing urea concentration (4.95-7.65 M urea in 0.45 M increments). The data are shown in grey and a single exponential fit to the data is shown as a black line. (B) Plot of the natural logarithm of the unfolding rate constant of wild-type human β2m (pH 7.0, 37 °C) vs. the urea concentration (M). The data are shown as grey squares and the linear fit to the data in black. The error on each point (2 standard deviations of the mean) is smaller than the data marker.