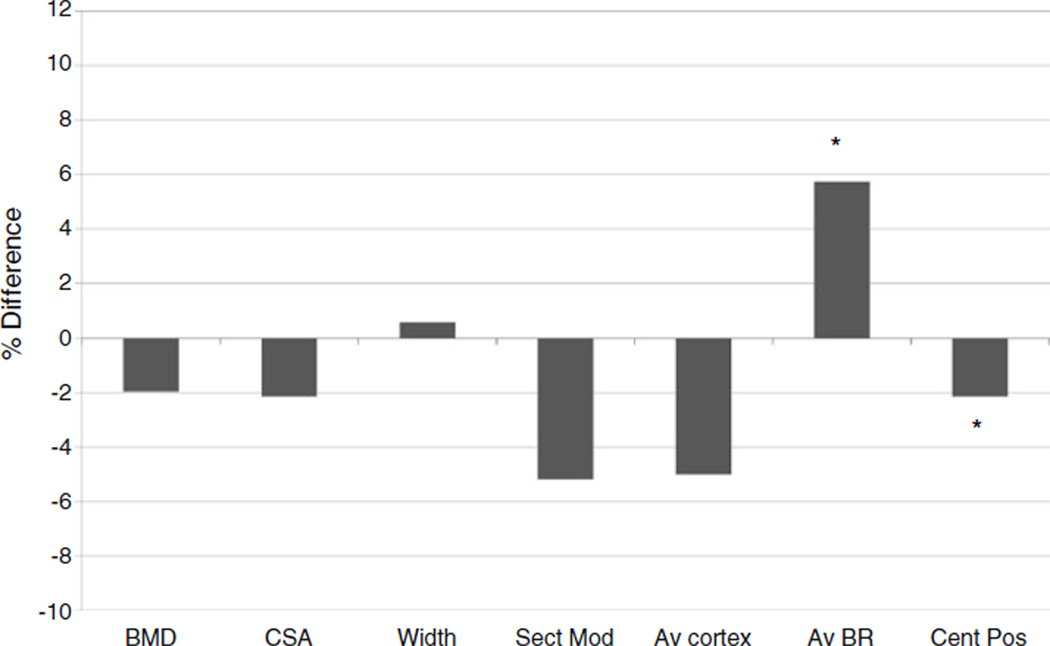
Fig. 1.
Percent difference in narrow neck hip structural analysis parameters, HIV/HCV cohort vs BACH/Bone cohort, after adjustment for race, age, smoking status, height, and weight. *p<0.05, BMD bone mineral density, CSA cross-sectional area, Sect Mod section modulus, Av cortex average cortical thickness, Av BR average buckling ratio, Cent Pos centroid position

