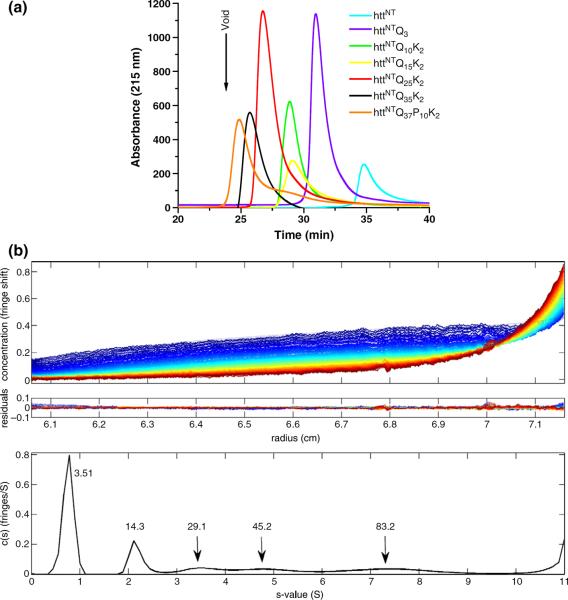
Fig. 1.
Molecular size distribution of httNTQN peptides in PBS, pH 7.5. (a) Analytical SEC (at 23 °C) of peptides. (b) Sedimentation velocity analysis of 50 μM httNTQ10K2 at 20 °C. Data were analyzed using a continuous c(s) distribution model implemented in the program SEDFIT. The frictional ratio for each sample was a fitted parameter in the analysis, yielding 1.58 for the monomer and 1.24 for the oligomeric species. Sedimentation data, with global fits, are shown for httNTQ10K2 in the top frame, and resulting residuals for the analysis are given below the experimental data in the middle frame. The c(s) profile for the peptide species is shown in the bottom frame.

