
Fig. 6.
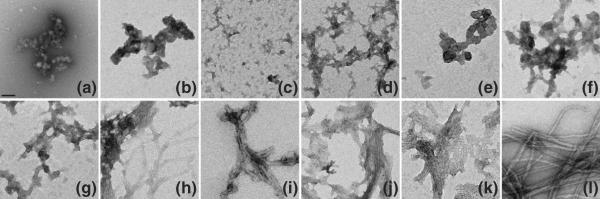
Negative stained EMs of httNTQN peptide aggregates: httNTQ3 (a, 2160 h), httNTQ4K2 (b, 912 h), httNTQ5K2 (c, 1210 h), httNTQ6K2 (d, 800 h), httNTQ7K2 (e, 820h), httNTQ8K2 (f, 840 h), httNTQ9K2 (g, 860 h), httNT Q10K2 (h, 800 h), httNTQ15K2 (i, 1080 h), httNTQ25K2 (j, 82 h), httNTQ35K2 (k, 24 h), and httNTQ37P10K2 (l, 20 h). The scale bar represents 50 nm.