
Fig. 7.
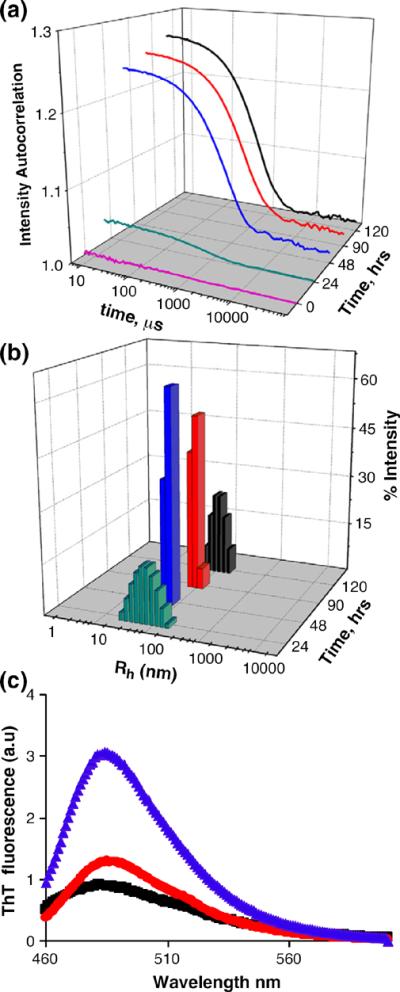
Analysis of httNTQNK2 aggregation. Autocorrelation functions (a) and particle size distributions (b) obtained from DLS measurements of 32.6 μM httNTQ7K2 incubated in PBS at 37 °C for the times indicated. (c) Fluorescence emission spectra of ThT alone (black) or bound to final aggregates of httNTQ7K2 (red) or httNTQ9K2 (blue) at monomer-equivalent concentrations of 30 μM.