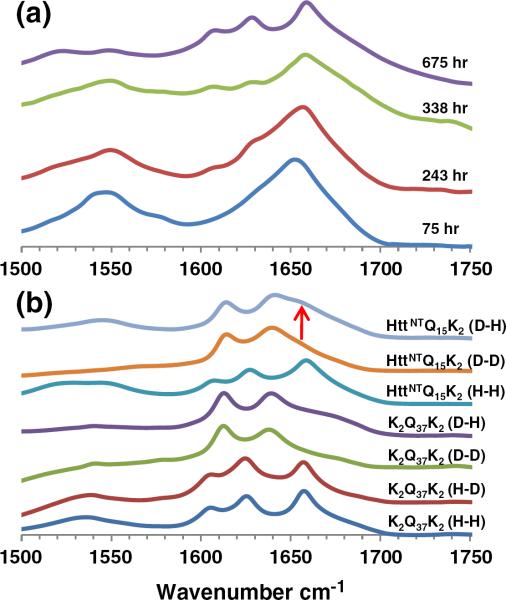
Fig. 8.
FTIR structural and mechanistic analysis. (a) Primary FTIR spectra of httNTQ8K2 aggregates collected at the times indicated. (b) Primary FTIR spectra of K2Q37K and httNTQ15K2 aggregates with different exposures to H2O (“H”) and D2O (“D”). The first letter indicates the solvent used for aggregate growth, and the second letter denotes the solvent used for measurement.

